

Infographics
Visual explanations of APIs, data and software concepts for everyday product work. The infographics bring together diagrams and comparisons that help follow technical conversations and revisit the differences between approaches. Each article adds context and examples to explain how those differences affect a product.
Product Observability: How PMs Can Understand Production Issues
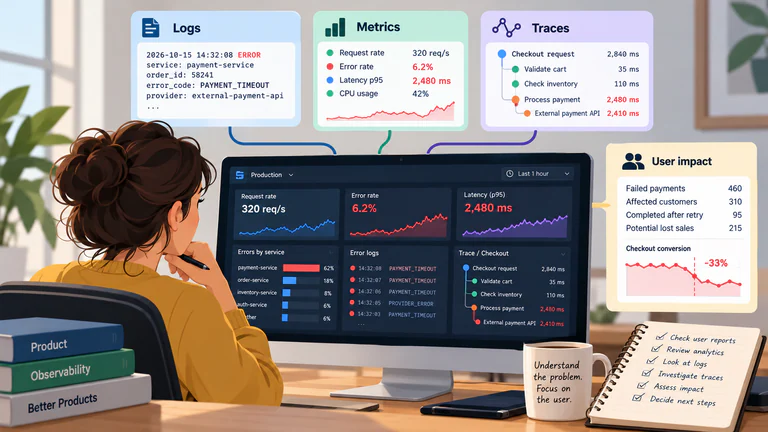
Follow a production issue from customer reports to technical evidence, assess its impact and define observability requirements for future releases.…
API Keys vs. OAuth: What Product Managers Need to Know
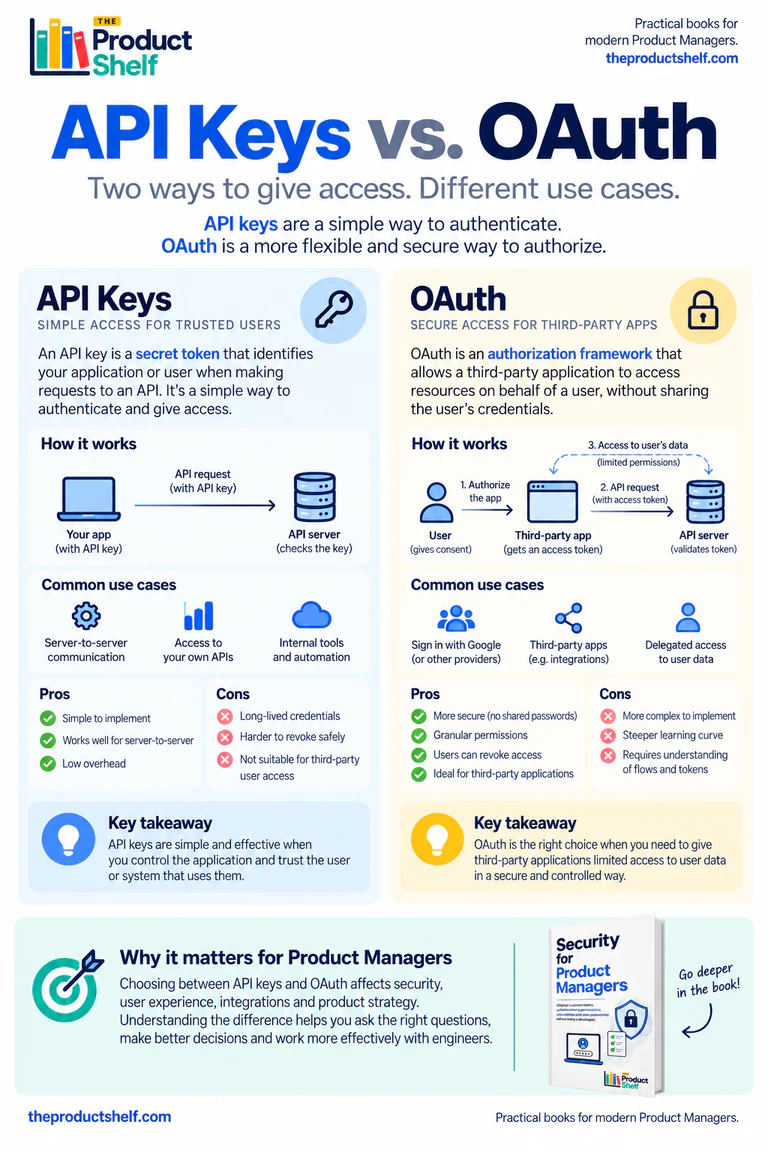
Compare API keys and OAuth through two B2B integrations: permissions, credential rotation, token renewal and what happens when a customer disconnects.…
Authentication vs. Authorization: What Product Managers Need to Know
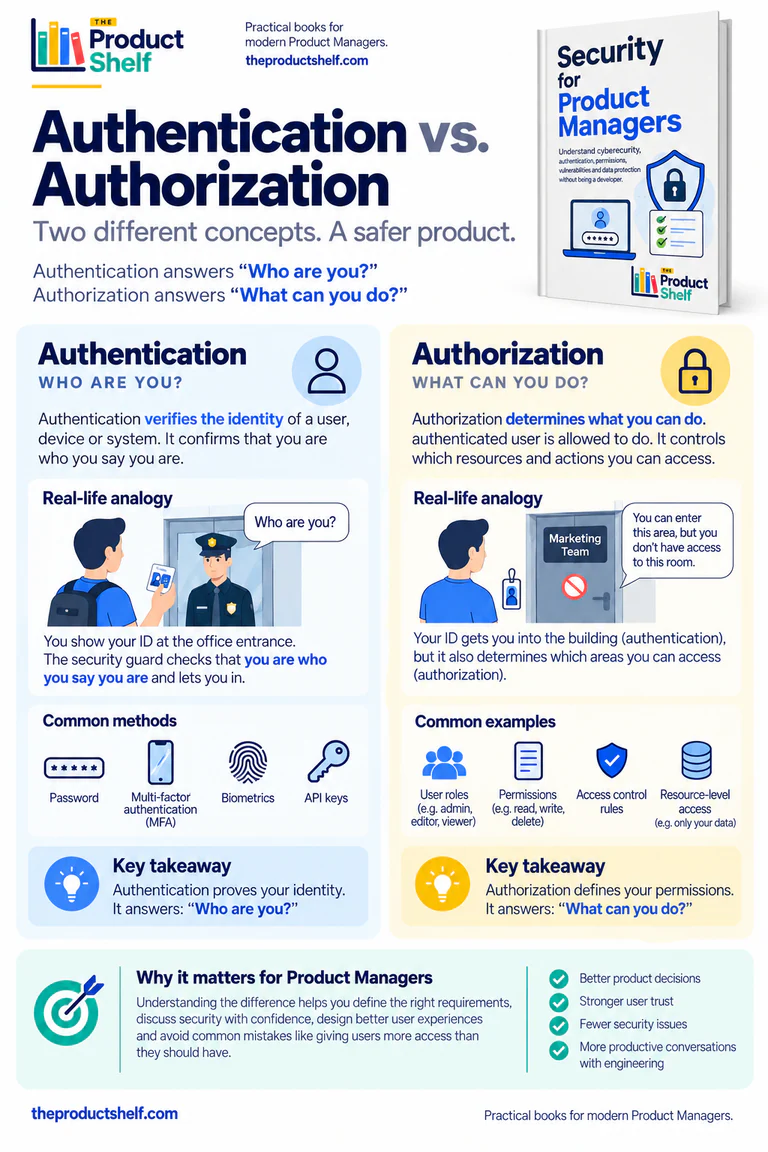
Authentication verifies identity; authorization controls access. A SaaS workspace example explains roles, resource boundaries and the permission rules behind an export feature.…
What Do the “Nines” of Availability Actually Mean?
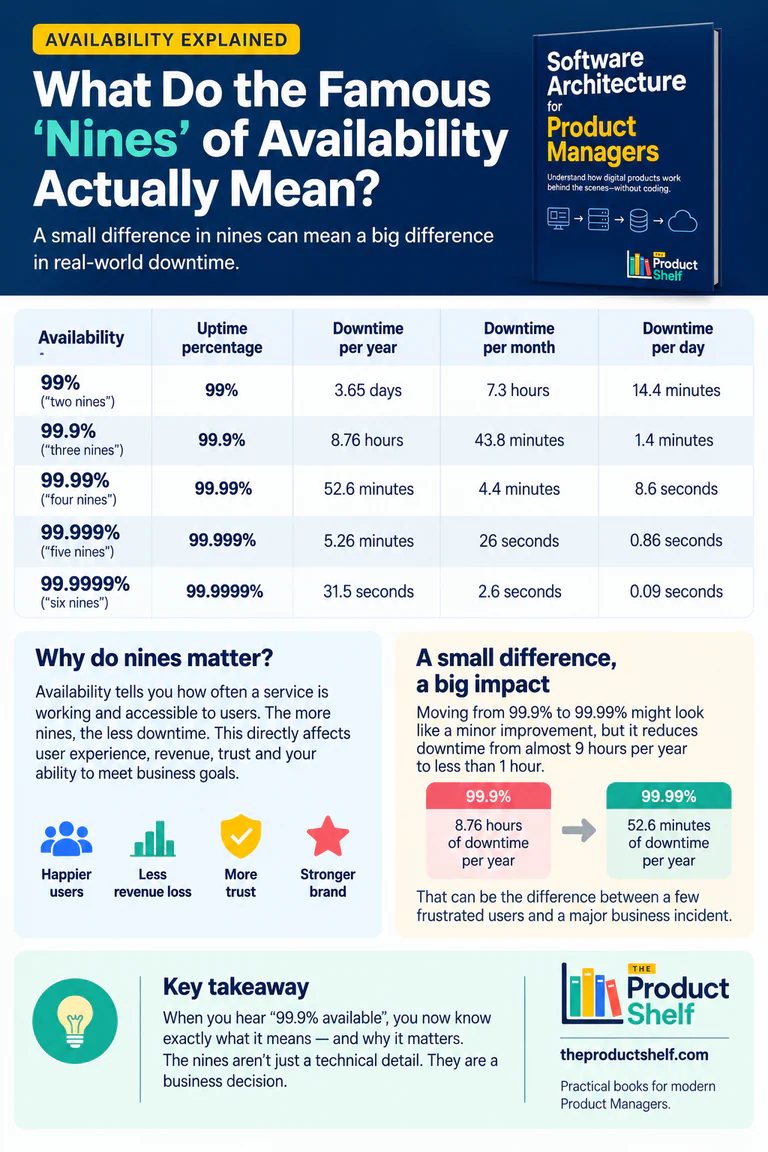
Translate availability percentages into downtime, define the measurement window and compare the product consequences and costs of three or four nines.…
Metrics Without Context Can Mislead You
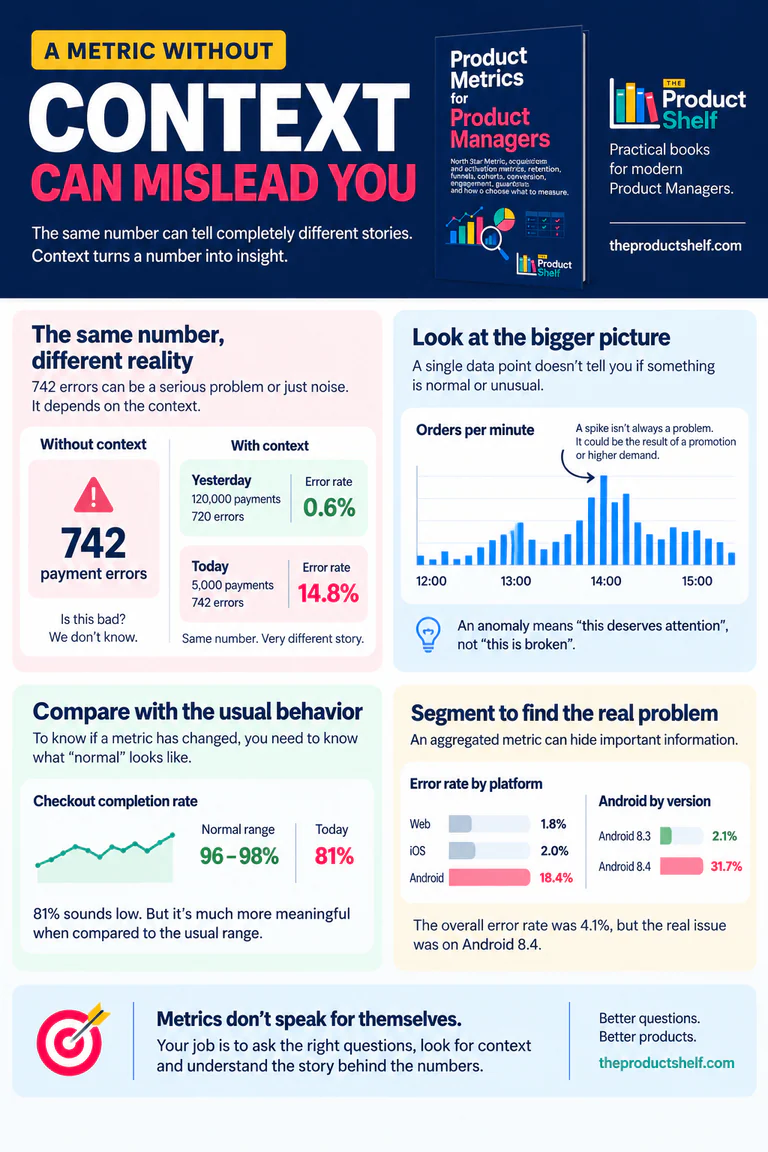
A count of payment errors needs a denominator, a time window and a baseline. This example shows how context changes the interpretation of a product metric.…
SQL for Product Managers: Turn Product Questions into Data
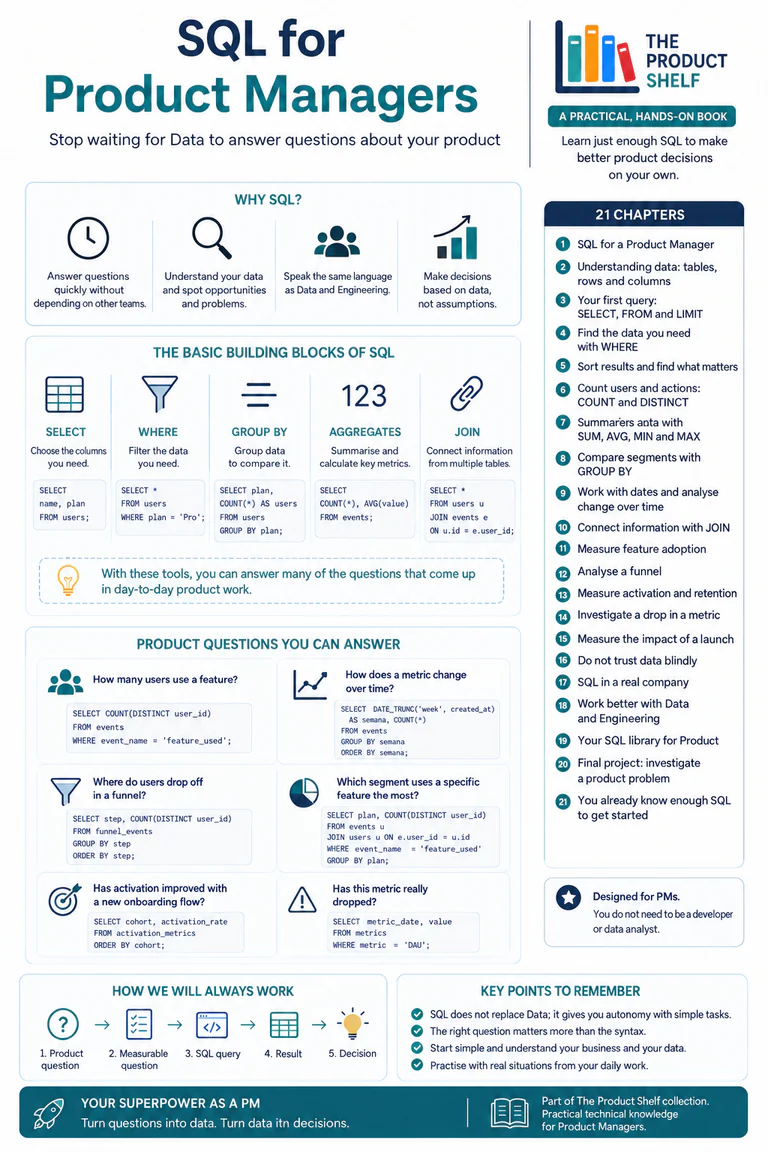
Turn a product question into a defined population, SQL calculation and reviewable result using filtering, grouping, aggregations and joins.…
APIs for Product Managers: A Visual Reference
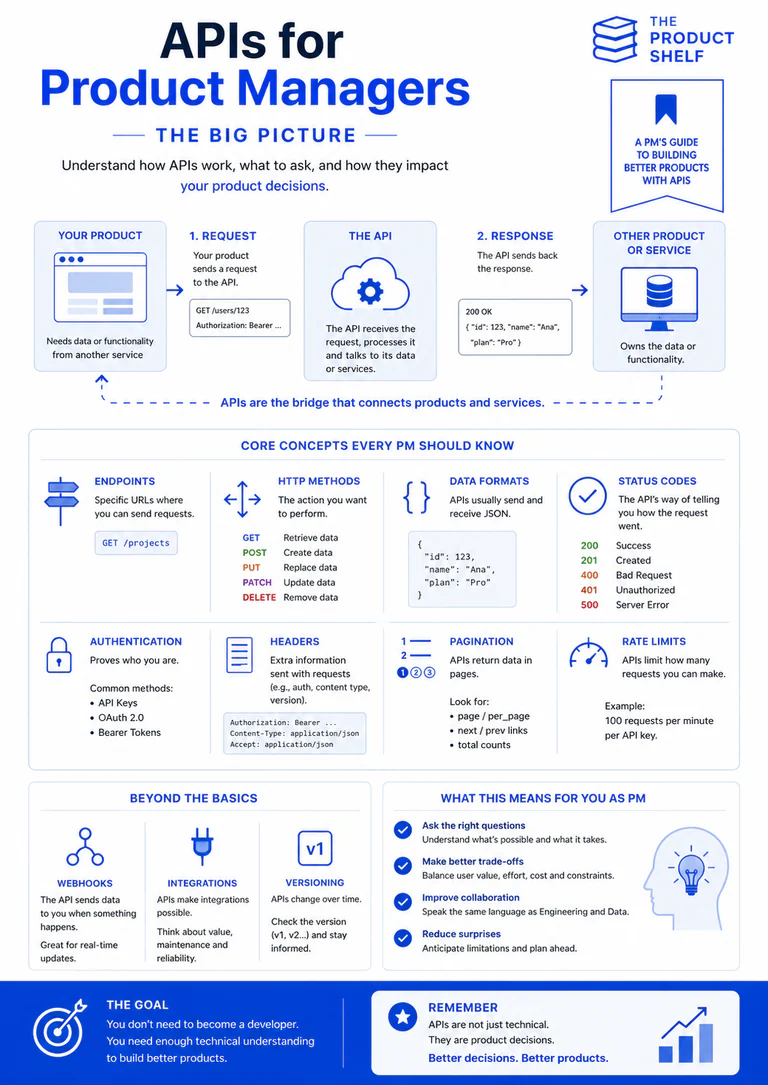
Use this API infographic as a quick reference to requests, methods and responses, with links to practical guides on permissions, limits and webhooks.…
API Rate Limits for Product Managers: When an API Says “Too Many Requests”
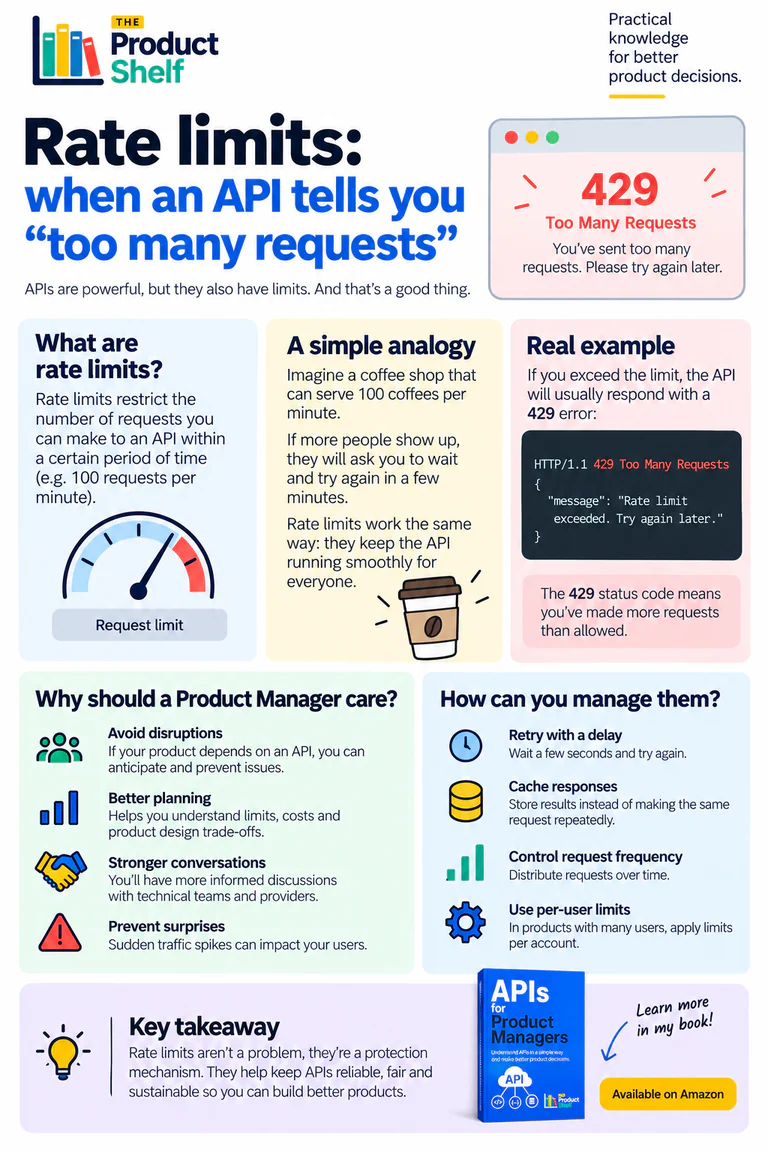
How API quotas affect integrations, what a 429 response means and which retry, caching and fallback decisions to agree before launch.…