

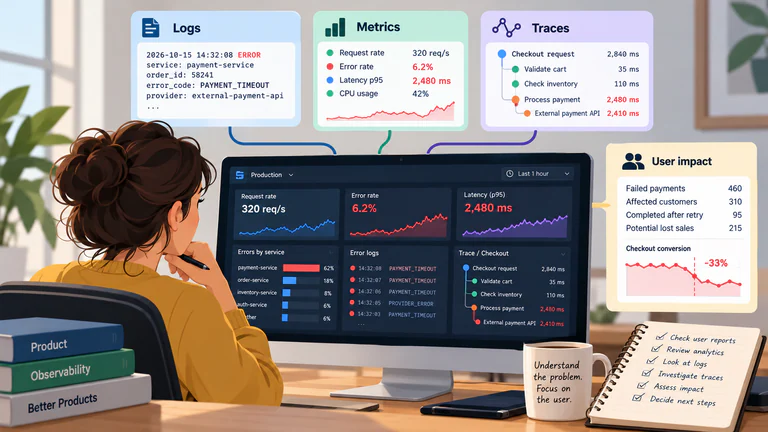
A customer reports that they cannot complete a payment. Support has received several similar complaints, but the product dashboard shows that checkout conversion is broadly stable. Engineering has started investigating, although the problem is difficult to reproduce and nobody is certain how many users are affected.
In this hypothetical incident, Support, Product and Engineering each hold part of the evidence. Reports describe the experience, analytics locate changes in behaviour and technical signals record the operations involved. The investigation needs to connect them before the team can estimate impact.
Product observability concerns the ability to understand how a product behaves in production, including the technical conditions that affect user journeys. It draws on information from application logs, performance metrics, distributed traces, product analytics, and other monitoring systems.
During incident assessment, those connections help establish the affected customers, possible workarounds and urgency of corrective work. Successful API responses can coexist with a journey that customers cannot finish.
1. What Is Product Observability?
Observability is a concept used in software engineering to describe how well the internal behavior of a system can be understood from the information it produces. In practice, this information may include logs, metrics, traces, and other diagnostic signals collected while the application is running.
Product observability applies these capabilities to questions about product behavior and user experience. It connects technical evidence with the journeys and outcomes that Product Managers are responsible for evaluating. An application might report that its servers are healthy and its API endpoints are responding successfully. Those indicators are useful, but they may not reveal that a particular group of customers cannot complete registration because of a problem with an external identity verification service.
The issue becomes visible when technical information is examined alongside the affected user journey. Authentication requests may be succeeding, while verification requests fail for customers from a particular country. Product analytics may show an increase in abandonment at the verification step, and Support may be receiving complaints from the same customer segment.
Together, these signals provide a clearer picture of the incident than any one source could offer independently.
Monitoring and Observability
Monitoring and observability are closely related, although they emphasize different activities. Monitoring typically involves tracking known indicators and checking whether they remain within expected limits. A team may monitor API response times, server resource consumption, or the percentage of failed transactions.
Observability provides the information and investigative capabilities needed to understand system behavior, including problems that were not anticipated when the monitoring rules were established. For example, an alert might notify Engineering that payment failures have exceeded an acceptable threshold. Monitoring detects the change, while observability tools help investigate which services, requests, or dependencies contributed to it.
The distinction is useful when discussing operational requirements. A product team may need alerts for known failure conditions while also requiring enough diagnostic information to investigate unexpected behavior.
2. The Three Main Signals: Logs, Metrics, and Traces
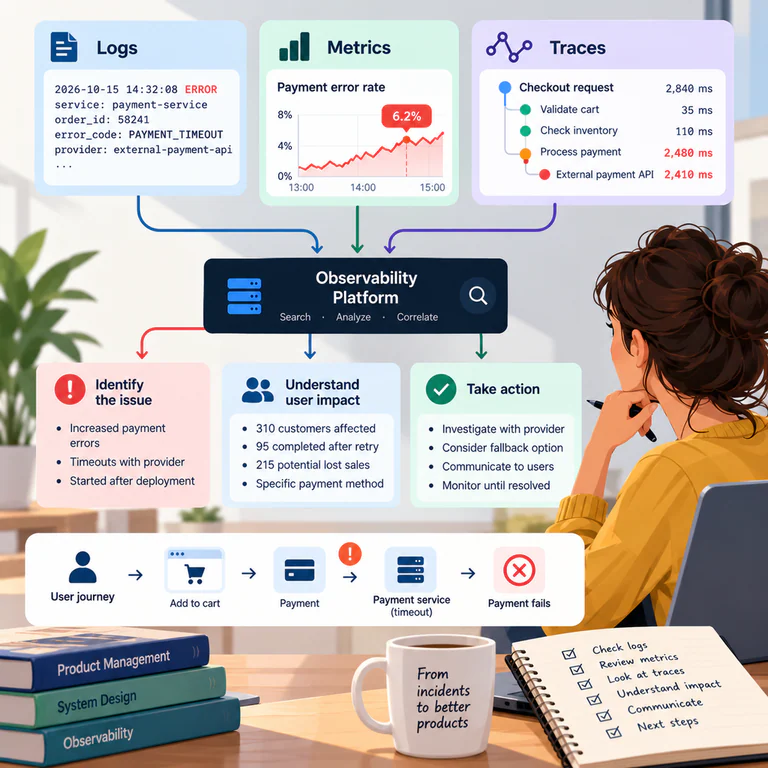
Software systems produce different types of operational information. Logs, metrics, and distributed traces are commonly used together because each provides a different perspective on application behavior.
Logs: What Happened?
Logs are records of events generated by applications and infrastructure. They may describe successful operations, validation failures, authentication attempts, exceptions, or interactions with external services. An e-commerce application could generate a log entry such as:
2026-10-15 14:32:08 ERROR
service: payment-service
order_id: 58241
error_code: PAYMENT_TIMEOUT
provider: external-payment-api
This entry indicates that a payment operation encountered a timeout while communicating with an external provider. A single log entry does not establish the extent of the problem, but it provides details that can help Engineering investigate. Searching for the same error code across a defined period may reveal whether the problem occurred once or affected hundreds of transactions.
Logs are particularly useful when investigating specific failures, especially when they contain consistent identifiers that allow related events to be connected. Tools such as Kibana can be used to search and analyze logs stored in Elasticsearch. Engineering teams may use them to identify recurring errors, inspect individual requests, and examine changes in application behavior.
Metrics: How Often and How Much?
Metrics are numerical measurements collected over time. They describe properties such as request volume, response time, error rates, resource usage, and service availability. For example, a payment service might report that its error rate increased from 0.4% to 6.2% during a fifteen-minute period.
That change indicates a deterioration in performance, although further investigation is needed to understand the cause. Metrics are particularly useful for identifying trends and comparing behavior across periods. They can reveal whether an issue is widespread, whether it began after a deployment, or whether performance is deteriorating gradually.
The selection of metrics matters. An average response time may remain stable even when a small proportion of users experience very slow requests. Percentile measurements, such as the 95th or 99th percentile, can provide additional information about the slower end of the response-time distribution.
For Product Managers, technical metrics become more useful when connected to the operations customers are trying to complete. An increase in API latency may be relatively harmless for a background synchronization process but particularly disruptive during checkout.
Traces: Where Did the Problem Occur?
Modern applications often rely on several services to complete a single user action. A checkout request might pass through an API gateway, an order service, an inventory service, and a payment provider before returning a result.
Distributed tracing records the progression of a request through these components, making it possible to examine how much time was spent in each operation and where errors occurred. A simplified trace could look like this:
Checkout request                 2,840 ms
├── Validate cart                  35 ms
├── Check inventory               110 ms
├── Calculate shipping            145 ms
└── Process payment             2,480 ms
    └── External payment API    2,410 ms
The trace suggests that most of the request time was spent waiting for the external payment provider. This information can guide the technical investigation. Engineering may need to examine provider latency, timeout settings, network conditions, or the application’s handling of slow responses.
The OpenTelemetry project provides open standards and tools for collecting telemetry, including traces, metrics, and logs.
3. Connecting Technical Problems to User Experience
A production issue becomes a product concern when it affects the ability of users to complete an intended action or receive the expected value from the application. Technical dashboards may show the frequency of errors, but Product Managers often need additional information to understand their consequences.
Consider a subscription platform where the authentication service experiences intermittent failures. Engineering reports that approximately 3% of login requests failed during the previous hour. That percentage provides an initial indication of the problem, but it leaves several questions unanswered. Were the failures concentrated among a particular group of users? Could customers retry successfully? Were paying customers affected? Did the problem prevent users from accessing essential functionality?
The answers can substantially change the assessment of severity. A 3% failure rate affecting all customers during a peak usage period may require a different response from the same failure rate affecting a rarely used internal administration tool.
Measuring the Impact of Production Issues
Product Managers can evaluate incidents using several dimensions:
| Dimension | Question |
|---|---|
| Reach | How many users or accounts were affected? |
| Severity | Which actions could users no longer complete? |
| Duration | How long did the problem persist? |
| Frequency | Was the failure intermittent or consistent? |
| Business impact | Did it affect payments, subscriptions, or other business outcomes? |
| Customer context | Were particular customer segments disproportionately affected? |
These dimensions help translate technical findings into product consequences. For example, a payment timeout affecting 200 checkout attempts does not necessarily mean that 200 customers were unable to purchase. Some attempts may have been retries, and some customers may have completed their transactions using another method.
Estimating the actual impact may require combining request logs with transaction records and product analytics. The distinction matters when communicating an incident to stakeholders. Reporting the number of failed requests as the number of affected customers can produce a misleading picture of the problem.
4. Investigating a Production Issue: A Practical Example
Returning to the e-commerce checkout problem, assume Support reports that several customers cannot complete payments using a particular payment method. The Product Manager wants to understand whether the issue is isolated, how many customers are affected, and whether it should interrupt planned development work.
Step 1: Establish What Users Are Experiencing
The investigation begins with the available customer reports. Support may have received complaints describing an error message after customers submit their payment details. Some customers report that retrying produces the same result, while others eventually complete their purchases.
At this stage, it is useful to establish the affected payment method, approximate time of occurrence, device or browser information when available, and any relevant transaction identifiers. The objective is to describe the observed behavior precisely enough for Engineering to investigate without assuming the technical cause.
Step 2: Examine Product Analytics
The Product Manager can compare checkout completion rates before and after the first reported failures. Suppose the overall conversion rate has declined only slightly, but conversion for one payment method has fallen from 74% to 41%.
This suggests that the problem may be concentrated in a particular part of the checkout experience. Segmenting by payment method, country, device, or application version may help narrow the investigation further.
These comparisons should account for traffic volume and normal variation. A large percentage change based on a handful of transactions may be less informative than a smaller change affecting thousands of customers.
Step 3: Review Technical Signals With Engineering
Engineering examines the payment service and identifies an increase in timeout errors associated with the affected provider. The team may use a log search such as:
service.name: "payment-service"
AND error.code: "PAYMENT_TIMEOUT"
The exact syntax depends on the logging platform and the structure of the indexed data. Logs reveal when the errors occurred and which requests were involved. Metrics show how the error rate changed over time, while traces help determine whether delays originated within the application or during communication with the provider.
Suppose the investigation shows that most affected requests waited several seconds for the provider before timing out. This provides evidence of a dependency problem, although the team may still need to determine whether the provider itself is degraded or whether the integration is handling its responses incorrectly.
Step 4: Estimate the Customer and Business Impact
The Product Manager can work with Engineering and Data to identify the number of unique customers affected and the proportion who eventually completed their purchases. A useful assessment might include:
| Measure | Illustrative result |
|---|---|
| Failed payment attempts | 460 |
| Unique customers affected | 310 |
| Customers who later completed payment | 95 |
| Customers without a completed purchase | 215 |
| Duration of elevated failures | 52 minutes |
These figures are hypothetical and would need to be derived from the product’s actual transaction and event data. Even then, the 215 customers without a completed purchase cannot automatically be treated as 215 lost sales. Some may have abandoned checkout for unrelated reasons, while others may return later.
The estimate can nevertheless help the team understand the potential commercial exposure and decide whether immediate intervention is justified.
Step 5: Decide on the Product Response
The appropriate response depends on the technical findings and the available alternatives. If the provider is experiencing an outage, the team might temporarily disable the affected payment method, route eligible transactions through another provider, or communicate the problem during checkout.
Each option introduces trade-offs. Disabling a payment method may prevent further failed attempts but reduce the available purchasing options. Retrying transactions automatically may improve recovery rates, but it requires safeguards against duplicate charges.
The Product Manager helps evaluate these options according to customer impact, business risk, and the expected duration of the incident. Once the problem is resolved, the team should verify that transaction success rates have returned to normal and examine whether any customers require follow-up or reconciliation.
5. Product Analytics and Technical Observability
Product analytics and technical observability often examine the same user journey from different perspectives. Product analytics records behavior such as page views, button clicks, completed purchases, and feature usage. Technical observability records how the underlying systems process requests and respond to operational conditions.
A user might click the checkout button, triggering a product analytics event. The application then sends a request to the payment service, which generates logs, metrics, and traces. If the payment fails, both perspectives are relevant. Product analytics can show whether the customer abandoned checkout or tried again, while technical telemetry can help identify the operation that failed.
| Product analytics | Technical observability |
|---|---|
| Checkout started | Checkout API request received |
| Payment method selected | Payment provider request initiated |
| Purchase completed | Payment authorization succeeded |
| Checkout abandoned | Request timeout or service error |
| User retried payment | Repeated request or transaction attempt |
The relationship between these events depends on the application’s instrumentation. Product analytics events and technical requests may use different identifiers, which can make investigations difficult when there is no reliable way to connect them.
Correlation IDs and User Journeys
A correlation ID is an identifier used to associate related operations or events. For example, when a checkout process begins, the application may generate a request identifier that is propagated through the services involved in processing the transaction.
Engineering can then use that identifier to find related logs and traces. In some systems, a session identifier or transaction identifier may also help connect technical events with product analytics.
These identifiers should be designed with privacy and security requirements in mind. Sensitive personal information, payment credentials, and authentication secrets should not be exposed in logs or tracing data. For Product Managers, understanding how events can be correlated is useful when defining requirements for investigating critical user journeys.
6. Defining Observability Requirements During Product Development
Observability is easier to implement when diagnostic requirements are considered during feature development. A team introducing a new subscription renewal process, for example, may define how renewals should behave under normal conditions but overlook the information needed to investigate failures after release.
If renewal attempts are not consistently recorded, it may be difficult to distinguish between payment declines, provider errors, expired credentials, and internal processing problems. The Product Manager can help identify the events and outcomes that need to be measurable.
For a subscription renewal flow, relevant questions might include whether the renewal was attempted, which provider processed it, whether it succeeded, whether retries occurred, and whether the customer was notified of the result.
Engineering determines how to instrument the system and which telemetry should be collected. Product Management helps establish which behaviors and failures matter for the user experience and business operations.
Observability Acceptance Criteria
Some features benefit from explicit observability requirements alongside functional acceptance criteria. For example:
- Failed renewal attempts must be identifiable by error category.
- The team must be able to distinguish payment declines from technical failures.
- Renewal processing time must be measurable.
- Repeated failures must be detectable through monitoring.
- Support must have a safe way to identify the status of a customer’s renewal.
These requirements are especially relevant for payment processing, authentication, data synchronization, and other operations where failures may be difficult for customers to diagnose. They should be proportionate to the feature’s risk and operational importance. A minor interface improvement may require little additional instrumentation, while a new payment integration may justify more extensive monitoring and diagnostic capabilities.
7. Using Observability to Prioritize Technical Problems
Product Managers often need to compare technical issues with feature development and other roadmap initiatives. An incident that affects a large number of users may clearly require immediate attention. Other problems are less straightforward, particularly when they occur intermittently or have no obvious effect on headline business metrics.
Observability data can help estimate the consequences of leaving a problem unresolved. Suppose a background synchronization service experiences recurring failures. Most users are unaware of the issue, but some accounts receive outdated information for several hours.
Engineering may identify the technical cause and estimate the work required to improve reliability. Product Management can investigate how many customers depend on the affected information, how frequently the problem occurs, and whether it influences support volume or customer satisfaction.
This evidence supports a more informed prioritization discussion.
Frequency, Severity, and Business Impact
Three useful dimensions are the frequency of the problem, the severity of its effect on users, and the business consequences. A frequent but minor interface error may be less urgent than a rare failure that causes incorrect billing. Similarly, a performance issue affecting a high-value enterprise workflow may deserve attention even if relatively few accounts are affected.
Technical metrics provide evidence about frequency and system behavior. Product analytics, customer reports, and business data help establish the consequences. The team should also consider whether the problem is becoming more frequent, whether temporary workarounds exist, and whether the underlying technical condition creates additional risks.
8. Observability and Product Reliability
Reliability is often described through technical measures such as uptime, error rates, and latency. These measurements are useful, but their relevance depends on which user operations they represent. A service may achieve high overall availability while an important customer journey experiences repeated failures.
For example, an application could remain accessible throughout the day even though its document export functionality is unavailable for several hours. The product’s general uptime metric might remain unchanged, but customers who depend on exports would experience a significant interruption.
Service Level Indicators and Objectives
A Service Level Indicator (SLI) is a measurement of a service’s behavior, such as the proportion of successful requests or the time required to complete an operation. A Service Level Objective (SLO) defines a target for an SLI over a specified period.
For a checkout service, an SLI might measure the proportion of valid checkout requests that receive a successful technical response. An SLO could establish the acceptable level of performance over a rolling period.
The exact definition needs care. A declined payment should not necessarily count as a service failure if the provider correctly processed the request and returned a legitimate decline. Similarly, a successful HTTP response does not always mean the user completed the intended operation.
Product and Engineering teams can work together to define indicators that represent meaningful aspects of the user journey while remaining technically measurable.
Google’s Site Reliability Engineering documentation provides additional background on defining and using SLOs.
9. Communicating Production Issues to Stakeholders
During an incident, stakeholders usually need a concise explanation of what is happening, who is affected, and what the team is doing. Technical investigations may involve detailed logs, traces, infrastructure metrics, and multiple competing hypotheses. Most stakeholders do not need that level of detail, particularly while the cause remains uncertain.
A useful incident update should distinguish confirmed facts from assumptions. For example:
Since approximately 14:30 UTC, some customers using a specific payment method have experienced checkout failures. Engineering has identified elevated timeout errors in the payment integration and is investigating the cause. Other payment methods appear to be operating normally. We are assessing the number of affected customers and will provide another update when the impact and recovery options are clearer.
This communicates the observed behavior and current investigation without presenting an unconfirmed root cause as fact. Once the incident is resolved, the team can provide a more complete account of the duration, customer impact, technical cause, corrective actions, and any follow-up work.
Post-Incident Reviews
A post-incident review examines what happened and how similar problems might be prevented or detected earlier. For Product Managers, the review can reveal gaps in user experience, operational processes, and product requirements.
A payment outage may expose the absence of a fallback method. An authentication failure may show that customers receive unclear error messages. A synchronization problem may reveal that the product does not communicate when information is outdated.
These findings can become product backlog items alongside technical improvements such as additional monitoring, safer retry mechanisms, or better dependency management.
10. Developing Observability Literacy as a Product Manager
Product Managers who work regularly with software incidents benefit from understanding the information available in their organization’s observability tools. A useful starting point is to review an existing production dashboard with Engineering and identify which metrics describe the product’s most important user journeys.
The next step is to examine how a specific failure appears in logs, metrics, and traces. Following a real incident from the initial customer report through technical diagnosis and resolution helps clarify what each source of information can reveal.
Tools such as Kibana, Grafana, and distributed tracing platforms provide different ways to explore operational data. Their interfaces and capabilities vary, but the underlying concepts are transferable. The Product Manager’s involvement will depend on the team’s responsibilities and access policies. In some organizations, Product can inspect dashboards directly. In others, Engineering or Site Reliability Engineering manages the investigation and shares relevant findings.
For a more detailed explanation of logs, Kibana, error investigation, and technical observability from a product perspective, see Logs, Kibana & Observability for Product Managers, part of The Product Shelf collection.
11. Making Production Behavior Part of Product Decisions
Production issues provide information about how a product behaves under real conditions, including circumstances that may be difficult to reproduce during testing. A feature can meet its functional requirements and still encounter problems related to traffic volume, external dependencies, unexpected user behavior, or data inconsistencies.
Observability makes these conditions easier to investigate, while product analytics and customer feedback help establish their consequences. For Product Managers, the practical application is to use this evidence during incident assessment, roadmap prioritization, feature planning, and post-release evaluation. A recurring technical error may justify changes to the product experience, while an apparently minor performance issue may reveal a larger problem when examined across an important customer segment.
After corrective work, compare the affected journey and technical signals with the agreed recovery criteria. Record remaining gaps in the evidence so that a fall in reported errors is not mistaken for confirmed customer recovery.