
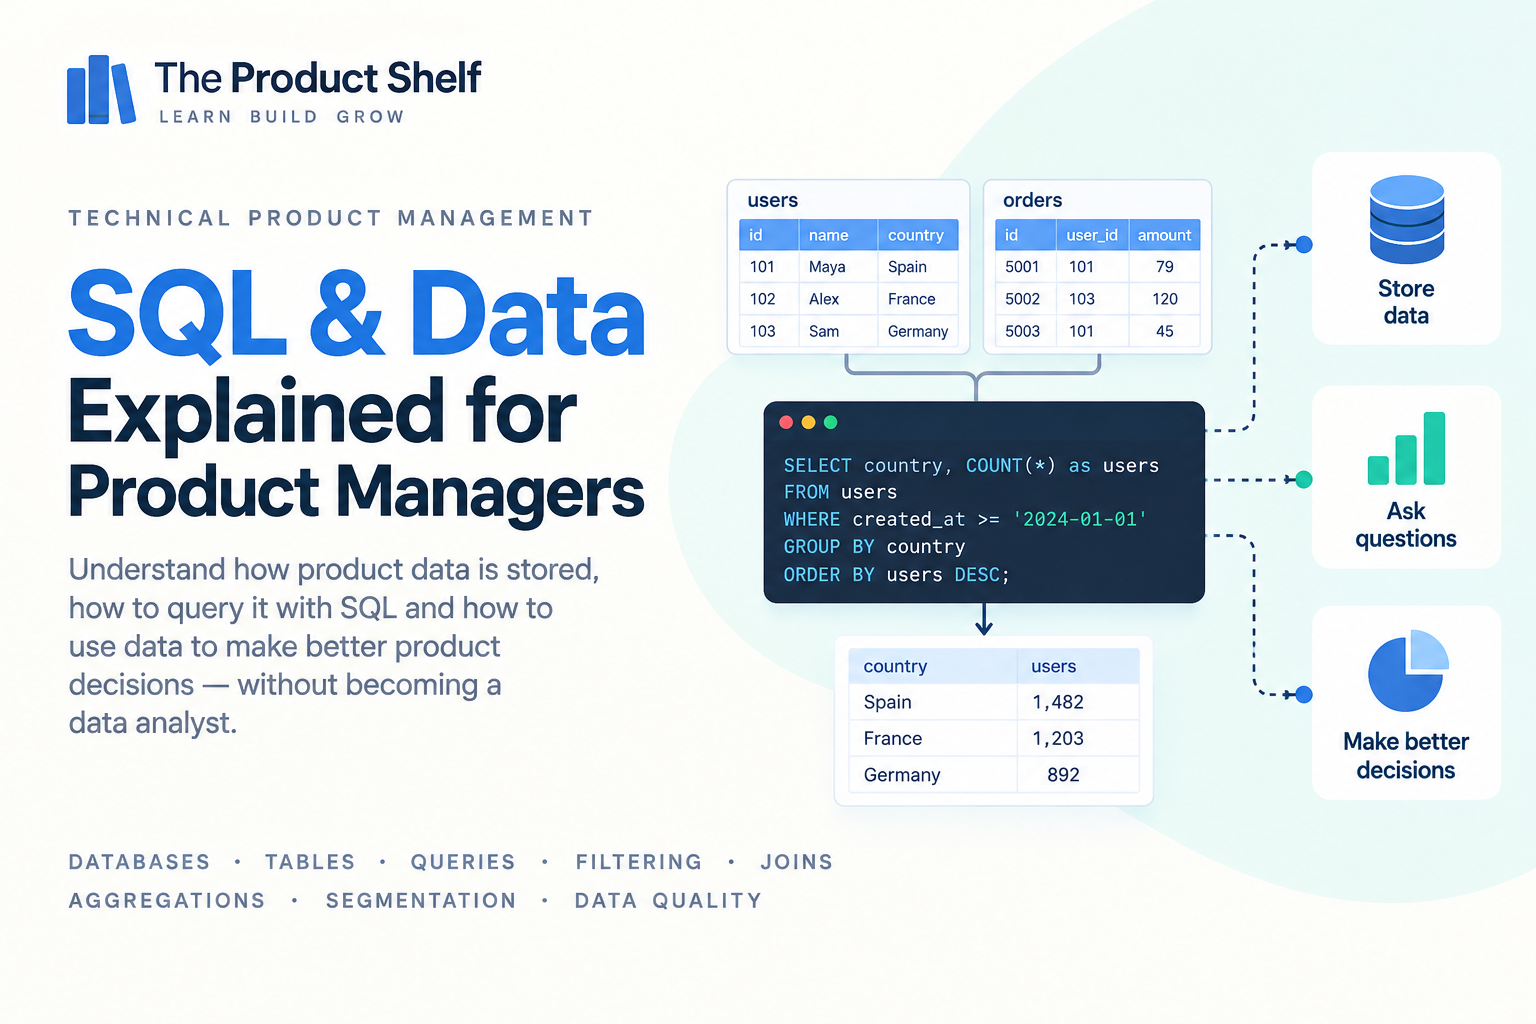
What Product Managers Need to Know About SQL & Data
Product Managers work with data constantly. We look at conversion rates, activation, retention, feature adoption and dozens of other metrics to understand what is happening in a product and decide what to do next.
Most of that information ultimately comes from data stored somewhere in our systems. Analytics tools and dashboards make it easier to access, but they also hide much of what happens underneath. Understanding some basic SQL and data concepts helps Product Managers look beyond the dashboard and think more clearly about where numbers come from, what they actually represent and how to investigate questions that aren’t already answered by an existing report.
You don’t need to become a data analyst or spend your days writing queries. The useful skill is understanding how product data is organised, how it can be queried and what you need to consider before trusting the answer.
What is SQL?
SQL — Structured Query Language — is a language used to interact with relational databases. It allows you to ask questions about the information stored there, retrieve specific records and combine or summarise data in different ways.
Imagine your company stores information about customers and their orders. With SQL, you could ask questions such as:
How many customers placed an order this month?
What is the average order value?
Which customers have never completed a purchase?
How many orders were placed in each country?
The database contains the underlying records, while SQL provides a way to query those records and turn them into useful information.
For Product Managers, that’s usually the most helpful way to think about SQL: it’s a way of asking structured questions about the data your product generates.
Why should Product Managers understand SQL?
Dashboards are useful when the question you want to answer has already been anticipated. If your analytics dashboard contains activation rate by platform, you can simply open it and look at the number.
Product work, however, tends to generate new questions.
Perhaps activation suddenly falls and you want to know whether the change affects all users or only Android customers. Maybe a feature is performing well overall but you suspect that new users behave differently from existing ones. Or perhaps a stakeholder asks a question that nobody has thought to add to a dashboard.
This is where understanding data becomes particularly useful. Even if you don’t write the final query yourself, knowing how data is structured helps you translate a broad product question into something that can actually be investigated.
Instead of asking:
“Why is activation worse?”
you can start breaking the problem down:
When did it change? Which users are affected? Does it vary by platform, country, acquisition channel or app version?
That shift from a vague question to a testable data question is often more valuable than knowing SQL syntax by heart.
Tables, rows and columns
Relational databases commonly organise information into tables. Each table usually represents a type of entity or information, such as customers, orders, subscriptions or products.
Imagine a simple customers table:
| customer_id | name | country |
|---|---|---|
| 101 | Anna | Spain |
| 102 | David | France |
| 103 | Sara | Spain |
Each row represents a record — in this case, a customer — while each column represents a particular attribute, such as the customer’s name or country.
An orders table might contain different information:
| order_id | customer_id | amount |
|---|---|---|
| 5001 | 101 | 49.99 |
| 5002 | 102 | 89.00 |
| 5003 | 101 | 25.50 |
Notice that both tables contain customer_id. That shared identifier allows us to connect a customer with their orders, which becomes particularly important when we start combining information from different tables.
You don’t need to know how the database was designed to understand the basic model: data is organised into records with attributes, and related records can often be connected through identifiers.
SELECT: retrieving data
One of the most basic SQL operations is SELECT, which is used to retrieve information from a table.
For example:
SELECT *
FROM customers;
Conceptually, this means:
“Give me all the information from the customers table.”
The * represents all available columns. If you only wanted specific information, you could request individual fields instead:
SELECT customer_id, country
FROM customers;
You don’t need to memorise the syntax. What’s useful is recognising what the query is asking for: which information do we want, and where should it come from?
WHERE: filtering data
Most product questions aren’t about every record in a database. Usually, we want to focus on a particular group.
The WHERE clause allows us to filter the data.
For example:
SELECT *
FROM customers
WHERE country = 'Spain';
Instead of returning every customer, this query only returns those whose country is Spain.
Filtering is one of the most important ideas for Product Managers because segmentation is essentially a form of filtering. When you ask whether a metric behaves differently for Android users, customers in Germany or people who registered last month, you’re defining a subset of the overall population.
The syntax may change depending on the question, but the underlying thinking remains the same: which users or records should be included in this analysis?
COUNT: how many?
A very common product question is simply: how many?
SQL provides functions such as COUNT for this purpose.
For example:
SELECT COUNT(*)
FROM customers
WHERE country = 'Spain';
This could answer:
How many customers are in Spain?
Counts appear everywhere in Product Management: registered users, completed orders, activated accounts, failed payments, support requests or people who used a particular feature.
But even a simple count requires a precise definition. Are we counting customers, accounts, sessions or events? Can the same user appear more than once? Are deleted accounts included?
The query can calculate the number perfectly while still answering the wrong product question if the underlying definition isn’t clear.
Aggregations
SQL can also summarise many records into useful statistics using aggregation functions.
Common examples include:
COUNT— how many records?SUM— what is the total?AVG— what is the average?MIN— what is the smallest value?MAX— what is the largest value?
Imagine an orders table containing thousands of transactions. Instead of inspecting each order individually, you might calculate:
SELECT AVG(amount)
FROM orders;
This gives you the average order value across the selected records.
Aggregations are powerful because they turn large datasets into understandable numbers. They are also where context starts to matter enormously. An average can hide very different behaviours within the population, which is why Product Managers often need to go one step further and segment the result.
GROUP BY: comparing groups
Suppose the overall average order value is €65. That number might be useful, but perhaps you want to know whether customers behave differently depending on their country.
A GROUP BY allows you to calculate the same metric separately for different groups:
SELECT country, COUNT(*)
FROM customers
GROUP BY country;
Instead of producing one overall customer count, the result might look like:
| country | customers |
|---|---|
| Spain | 4,820 |
| France | 3,410 |
| Germany | 2,950 |
This is the basis of many analyses Product Managers perform every day. Rather than asking only “What is our activation rate?”, you might ask what activation looks like by platform, market, acquisition channel or customer type.
Breaking an aggregate into groups can reveal patterns that disappear completely when everything is combined into a single average.
JOIN: connecting information
Product data is rarely stored in one giant table. Customer information may live in one table, orders in another and subscription information somewhere else.
A JOIN allows data from related tables to be combined.
Remember our two tables:
Customers
| customer_id | name | country |
|---|---|---|
| 101 | Anna | Spain |
| 102 | David | France |
Orders
| order_id | customer_id | amount |
|---|---|---|
| 5001 | 101 | 49.99 |
| 5002 | 102 | 89.00 |
Because both contain customer_id, we can connect each order with the customer who placed it.
Conceptually:
Customers + customer_id + Orders
This could allow us to answer questions such as:
What is the average order value by customer country?
That question requires information from both tables: the order amount comes from the orders table, while the country comes from the customer record.
You don’t need to master every type of JOIN to benefit from the concept. The important thing is understanding that answering one product question may require combining information stored in several places.
Identifiers
Identifiers are what allow systems to distinguish one record from another and often provide the connection between different datasets.
A user might have a:
user_id
An order might have an:
order_id
A subscription might have a:
subscription_id
These identifiers become particularly important when combining data. Names and email addresses can change or may not be unique, while an internal identifier is usually designed to refer to one specific record.
For Product Managers, this becomes relevant when discussing questions such as whether data from two systems can be connected. If your analytics platform uses one identifier and the billing system uses another, the team needs some way to reliably map the same customer across both systems.
NULL: missing isn’t always zero
One concept that frequently causes confusion in data analysis is NULL.
NULL generally represents the absence of a value. It doesn’t necessarily mean zero, false or an empty string.
Imagine a table containing:
| customer | purchases |
|---|---|
| Anna | 3 |
| David | 0 |
| Sara | NULL |
David has made zero purchases. Sara’s value, however, is missing. Perhaps her data hasn’t been imported, the field wasn’t tracked when she registered or the information isn’t available for some other reason.
Treating NULL as zero would therefore change the meaning of the data.
This is a small technical distinction with potentially large analytical consequences. Before interpreting a metric, it is worth understanding what missing data means in that particular dataset.
Dates and time zones
Time sounds simple until you start analysing data across systems, countries and time zones.
Imagine someone asks:
“How many orders did we receive yesterday?”
Before answering, you may need to define what “yesterday” means. Yesterday in Spain? UTC? The customer’s local time? The timezone configured in the analytics platform?
An order placed at 00:30 in Madrid may still belong to the previous calendar day in another timezone. This becomes particularly important when comparing reports generated by different systems, because they may not use the same time conventions.
Dates can also be stored in different formats or represent different moments: when an order was created, when payment was confirmed, when it was shipped or when it was completed.
So whenever a product question depends on time, make sure you understand which timestamp is being used and in which timezone it is interpreted.
Data quality
Having data doesn’t automatically mean having trustworthy data.
Tracking can break. Events can be sent twice. A field may stop being populated after a release. Historical data may use a different definition from current data, or one platform may behave differently from another.
Imagine your dashboard shows that activation has suddenly fallen by 20%. That could mean user behaviour has genuinely changed, but it could also mean that an event used to calculate activation is no longer being tracked correctly.
Before reacting to a surprising number, it is worth asking whether the data itself is healthy.
Useful checks might include whether tracking changed recently, whether the movement affects all platforms, whether another data source shows the same pattern and whether the metric definition has remained consistent.
Good Product Management isn’t only about using data. It’s also about knowing when to question the data you’re using.
SQL vs analytics tools
Product Managers often work with tools that make analysis possible without writing SQL. Dashboards, product analytics platforms and business intelligence tools can provide answers much faster than querying a database directly.
That doesn’t make SQL irrelevant.
Analytics tools usually present data according to models, events and metrics that someone has already defined. SQL can become useful when the question falls outside those predefined views or when you need to investigate the underlying data more directly.
The two approaches aren’t competitors. A dashboard may be the fastest way to monitor activation every week, while a SQL query might help investigate why activation changed for one specific group of users.
The best tool depends on the question you’re trying to answer.
Translating a product question into a data question
One of the most valuable data skills for a Product Manager is learning to turn a broad business question into something measurable.
Imagine someone asks:
“Are users finding the new onboarding better?”
That’s not yet a data question. First, you need to decide what “better” means.
Perhaps you care about completion:
What percentage of users finish onboarding?
Maybe speed matters:
How long does onboarding take?
Perhaps the real outcome is activation:
Are users who complete the new onboarding more likely to reach our activation milestone?
You may then need to define the population, time period and comparison:
New users exposed to onboarding B during the last four weeks vs users exposed to onboarding A during the previous four weeks.
At that point, the original vague question has become something an analyst, a dashboard or a SQL query can actually investigate.
This translation from product question → measurable definition → data question is far more important for most Product Managers than writing sophisticated SQL.
Questions Product Managers should ask about data
When looking at a metric or requesting an analysis, it helps to clarify a few things before jumping to conclusions.
Start with the definition. What exactly are we measuring? If we’re talking about an activated user, what needs to happen for someone to count as activated?
Then look at the population. Which users are included or excluded? Are we looking at all registered users, paying customers, new accounts or only people who reached a certain point in the journey?
Time matters too. Which period are we analysing, which timestamp is being used and what are we comparing it with?
It’s also worth understanding the source of the information. Does it come from analytics events, a production database, a CRM or another system? Is the tracking complete and reliable?
Segmentation can reveal whether an overall movement is hiding something more specific. Does the pattern change by platform, market, acquisition channel, customer type or app version?
Finally, keep the decision in mind. What are we trying to learn, and what would we do differently depending on the answer? Data analysis is much more useful when it is connected to a product decision rather than performed simply because the information is available.
Do Product Managers need to know SQL?
Not every Product Manager needs to write SQL regularly. The answer depends on the company, the product and how easily data can be accessed through other tools.
In some organisations, PMs are expected to query data themselves. In others, analysts or data teams handle most of the SQL work. Many companies sit somewhere in between.
Even when you aren’t expected to write queries, understanding the basic concepts is extremely useful. Knowing what tables, filters, aggregations, joins and identifiers are makes it easier to understand how an analysis was produced and to communicate clearly with Data and Engineering teams.
If you do learn enough SQL to perform simple queries yourself, it can also remove a lot of friction from everyday product work. You don’t need to wait for someone else every time you want to check a small hypothesis or inspect a subset of users.
How much SQL does a Product Manager need?
You don’t need to become a database specialist. For most Product Managers, a practical foundation is enough.
Understanding SELECT, WHERE, COUNT, basic aggregations, GROUP BY and JOINs already allows you to follow a large proportion of everyday product analysis. Just as importantly, you should understand concepts such as identifiers, NULL values, dates, segmentation and data quality, because those are often where analytical mistakes happen.
The goal isn’t to write the cleverest query. It’s to become better at moving from:
“Something seems to be happening in the product”
to:
“What data would help us understand what’s actually happening?”
That’s the skill that makes SQL genuinely useful for Product Management.
Go deeper: SQL for Product Managers
This guide gives you the foundations for understanding how product data is stored, queried and analysed.
If you want to go further, SQL for Product Managers focuses on SQL from a Product Manager’s perspective, helping you learn how to explore data, answer product questions and communicate more effectively with Data and Engineering teams without needing to become a data analyst.
Continue learning Technical Product Management
SQL becomes much more powerful when it’s connected to the wider product context. Understanding databases helps you make sense of software architecture, while knowing how to query and segment information gives you a stronger foundation for working with product metrics.
Continue with the Technical Product Management learning path to explore APIs, software architecture, product metrics, observability, security and CI/CD.
Explore the book → SQL for Product Managers



SQL for Product Managers
Product Managers work with data every day, but getting answers shouldn’t always mean waiting for an analyst or asking someone else to write a query.
SQL for Product Managers gives you the practical SQL knowledge you need to explore product data independently and answer many of the questions that appear in your day-to-day work.
Continue learning Technical Product Management
SQL and data are one part of the technical landscape behind modern products.
The Technical Product Management learning hub also covers APIs, software architecture, product metrics, logs and observability, security, and CI/CD and releases.
Explore the Technical Product Management learning hub
Leave a Reply