

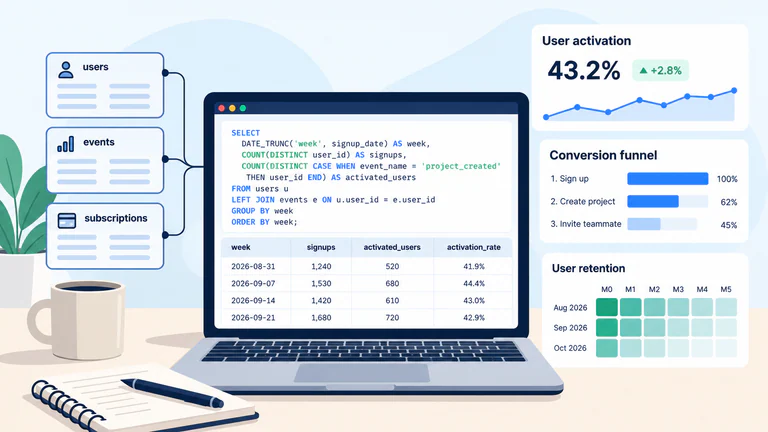
Product Managers regularly work with metrics that describe how people discover, adopt, and use a product. Most of these metrics come from data stored across several tables: user accounts, events, subscriptions, transactions, and other records generated as people interact with the application. SQL provides a way to retrieve that information and turn it into answers to specific product questions.
A Product Manager investigating a drop in activation, for example, may want to know how many new users completed onboarding, how long it took them to reach their first meaningful action, or whether activation differs between acquisition channels. These questions can often be answered by combining user records with behavioral events and applying the appropriate filters and aggregations.
SQL is particularly useful when the available dashboards don’t provide the level of detail needed for an investigation. It allows the analysis to be adjusted as new questions arise, provided the underlying data is accessible and reliable.
This article presents seven practical SQL examples covering common product analytics scenarios. Each example starts with a product question, explains the data required, and shows how a query can be used to investigate it.
1. Understanding the Data Behind Product Analytics
Before writing queries, it helps to understand how product data is organized. Most digital products store information in multiple tables, each representing a different type of entity or activity.
A subscription-based application, for example, might have a users table containing account information, an events table recording user actions, and a subscriptions table describing paid plans.
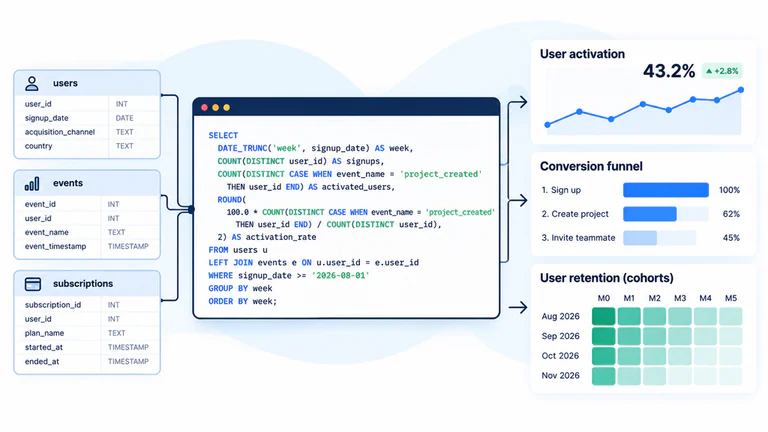
The examples use the following simplified database structure.
Users
| Column | Description |
|---|---|
| user_id | Unique identifier for each user |
| signup_date | Date the account was created |
| acquisition_channel | Channel through which the user was acquired |
| country | User’s country |
Events
| Column | Description |
|---|---|
| event_id | Unique event identifier |
| user_id | User who performed the action |
| event_name | Name of the recorded event |
| event_timestamp | Date and time of the event |
Subscriptions
| Column | Description |
|---|---|
| subscription_id | Unique subscription identifier |
| user_id | Associated user |
| plan_name | Subscription plan |
| started_at | Subscription start timestamp |
| ended_at | Subscription end timestamp, if applicable |
The hypothetical product is a project management application where users create projects, invite teammates and manage tasks. Its event tracking includes project_created, task_created, teammate_invited and session_started.
The examples use PostgreSQL syntax. Other databases, including BigQuery, Snowflake, and MySQL, support similar operations, although date functions and certain SQL expressions may differ. The data model is intentionally simplified. Production databases often contain additional tables, event properties, identity mappings, and business rules that need to be considered before calculating metrics.
2. Example 1: Measuring User Activation
Product question: What percentage of new users complete their first meaningful action?
A signup tells us that someone created an account, but it doesn’t establish whether they experienced the product’s intended value. For a project management application, creating a first project could be a reasonable initial activation event, although the team should validate whether that action is genuinely associated with subsequent engagement.
Suppose the Product Manager wants to measure the percentage of users who create a project within seven days of signing up. The calculation requires two groups: users who signed up during the analysis period and those who completed the activation event within the defined window.
WITH new_users AS (
    SELECT
        user_id,
        signup_date
    FROM users
    WHERE signup_date >= DATE '2026-09-01'
      AND signup_date < DATE '2026-10-01'
),
activated_users AS (
    SELECT DISTINCT
        u.user_id
    FROM new_users u
    JOIN events e
      ON u.user_id = e.user_id
    WHERE e.event_name = 'project_created'
      AND e.event_timestamp >= u.signup_date
      AND e.event_timestamp < u.signup_date
          + INTERVAL '7 days'
)
SELECT
    COUNT(DISTINCT u.user_id) AS signups,
    COUNT(DISTINCT a.user_id) AS activated_users,
    ROUND(
        100.0 * COUNT(DISTINCT a.user_id)
        / NULLIF(COUNT(DISTINCT u.user_id), 0),
        2
    ) AS activation_rate
FROM new_users u
LEFT JOIN activated_users a
  ON u.user_id = a.user_id;
The first Common Table Expression (CTE) selects users who signed up in September. The second identifies those who created a project during their first seven days. The final query calculates the proportion of new users who met that condition.
If 1,000 users signed up and 420 created a project within seven days, the activation rate would be 42%. This result becomes more useful when tracked over time or compared across segments. A declining activation rate might indicate problems in onboarding, changes in acquisition quality, or technical issues affecting the first project creation flow.
The seven-day window also matters. Users who signed up near the end of September must have their activity observed into October. Without that additional data, recent signups could be incorrectly classified as inactive.
3. Example 2: Analyzing a Conversion Funnel
Product question: Where do users drop off during onboarding?
A conversion funnel describes the progression through a sequence of actions. In our project management application, onboarding might involve creating an account, creating a project, and inviting a teammate. To analyze this journey, we need to identify how many users complete each step in the expected order.
WITH signups AS (
    SELECT
        user_id,
        signup_date::timestamp AS signup_at
    FROM users
    WHERE signup_date >= DATE '2026-09-01'
      AND signup_date < DATE '2026-10-01'
),
first_project AS (
    SELECT
        s.user_id,
        MIN(e.event_timestamp) AS project_at
    FROM signups s
    JOIN events e
      ON s.user_id = e.user_id
     AND e.event_name = 'project_created'
     AND e.event_timestamp >= s.signup_at
    GROUP BY s.user_id
),
first_invite AS (
    SELECT
        p.user_id,
        MIN(e.event_timestamp) AS invite_at
    FROM first_project p
    JOIN events e
      ON p.user_id = e.user_id
     AND e.event_name = 'teammate_invited'
     AND e.event_timestamp >= p.project_at
    GROUP BY p.user_id
)
SELECT
    (SELECT COUNT(*) FROM signups) AS signed_up,
    (SELECT COUNT(*) FROM first_project) AS created_project,
    (SELECT COUNT(*) FROM first_invite) AS invited_teammate;
The query counts users who signed up, then those who created a project after signup, and finally those who invited a teammate after creating a project. An illustrative result might look like this:
| Funnel step | Users | Conversion from previous step |
|---|---|---|
| Signed up | 1,000 | — |
| Created a project | 620 | 62.0% |
| Invited a teammate | 280 | 45.2% |
The largest proportional drop occurs between project creation and inviting a teammate. This gives the Product Manager a specific area to investigate, although the numbers alone don’t explain why users stop progressing.
Some users may prefer to explore the application individually before inviting colleagues. Others may find the invitation flow confusing, lack the necessary permissions, or simply have no immediate reason to collaborate.
The next step could involve segmenting the funnel by acquisition channel, device, or customer type, then combining the quantitative results with qualitative research.
Before acting on a drop in activation
Illustrative scenario: a dashboard shows activation falling from 42% to 35%. That is a reason to investigate, not yet proof that the new onboarding caused the decline. Before changing the product, check what was counted.
- Compare complete windows. If activation means creating a project within seven days, give both signup cohorts the full seven days. Do not compare a mature cohort with users who joined yesterday.
- Count users, not event rows. A user who creates four projects should still contribute one activated user. A JOIN can multiply rows, so inspect the grain before aggregating.
- Check the acquisition mix. Compare activation within each channel as well as overall. A larger share of a lower-activation channel can lower the total even when each channel's rate is unchanged.
- Verify tracking. Check whether the event definition, identity mapping or collection changed with the release.
Suppose both cohorts have 1,000 signups, but the later cohort is still inside its observation window. Its 350 activated users are a partial count. Waiting for the window to close can change the interpretation; it does not guarantee that the final rate will recover.
Decision to take away: document the cohort, activation event, observation window and exclusions next to the query. Then decide whether the evidence supports a product change or whether the next step is a data check.
See the PostgreSQL guide to aggregates for the calculation mechanics. To choose between learning queries and defining metrics, use our technical book guide.

This query also illustrates an important limitation of funnel analysis: the definition of each step influences the result. Here, users must complete the events in order, but there is no maximum time allowed between them. Adding a seven-day completion window would produce a different metric.
4. Example 3: Measuring Feature Adoption
Product question: How many active users are adopting a new feature?
Feature adoption measures how widely a capability is being used among a relevant population. The denominator is particularly important because adoption can look very different depending on whether it’s calculated against all registered users, monthly active users, or users eligible to access the feature.
Suppose the application recently introduced task templates, recorded through a template_used event. The Product Manager wants to measure adoption among users who were active during September.
For this example, an active user is someone who generated at least one session_started event during the month.
WITH active_users AS (
    SELECT DISTINCT user_id
    FROM events
    WHERE event_name = 'session_started'
      AND event_timestamp >= TIMESTAMP '2026-09-01'
      AND event_timestamp < TIMESTAMP '2026-10-01'
),
feature_users AS (
    SELECT DISTINCT user_id
    FROM events
    WHERE event_name = 'template_used'
      AND event_timestamp >= TIMESTAMP '2026-09-01'
      AND event_timestamp < TIMESTAMP '2026-10-01'
)
SELECT
    COUNT(DISTINCT a.user_id) AS active_users,
    COUNT(DISTINCT f.user_id) AS feature_users,
    ROUND(
        100.0 * COUNT(DISTINCT f.user_id)
        / NULLIF(COUNT(DISTINCT a.user_id), 0),
        2
    ) AS adoption_rate
FROM active_users a
LEFT JOIN feature_users f
  ON a.user_id = f.user_id;
If 2,000 users were active during September and 350 used task templates, the adoption rate would be 17.5%. That percentage describes reach, but it doesn’t tell us whether the feature is useful or whether people continue using it. A user who tries a template once is counted in the same way as someone who relies on templates every day.
Further analysis could examine repeat usage, the number of templates created, or whether template adoption is associated with faster task creation. If the feature is available only on certain subscription plans, the denominator should also exclude users who cannot access it. Otherwise, the adoption rate would understate usage among the intended audience.
5. Example 4: Calculating Weekly Retention
Product question: How many users return to the product after their first week?
Retention measures whether users continue engaging with a product after an initial interaction or starting point. The definition varies depending on the product and the behavior being measured.
For our application, we’ll calculate first-week retention by checking whether users who signed up during a given week generated a session_started event between seven and fourteen days after signup.
WITH signup_cohorts AS (
    SELECT
        user_id,
        signup_date,
        DATE_TRUNC('week', signup_date)::date
            AS cohort_week
    FROM users
    WHERE signup_date >= DATE '2026-08-01'
      AND signup_date < DATE '2026-10-01'
),
retained_users AS (
    SELECT DISTINCT
        u.user_id
    FROM signup_cohorts u
    JOIN events e
      ON u.user_id = e.user_id
    WHERE e.event_name = 'session_started'
      AND e.event_timestamp >= u.signup_date
          + INTERVAL '7 days'
      AND e.event_timestamp < u.signup_date
          + INTERVAL '14 days'
)
SELECT
    u.cohort_week,
    COUNT(DISTINCT u.user_id) AS new_users,
    COUNT(DISTINCT r.user_id) AS retained_users,
    ROUND(
        100.0 * COUNT(DISTINCT r.user_id)
        / NULLIF(COUNT(DISTINCT u.user_id), 0),
        2
    ) AS week_1_retention
FROM signup_cohorts u
LEFT JOIN retained_users r
  ON u.user_id = r.user_id
GROUP BY u.cohort_week
ORDER BY u.cohort_week;
The result groups users by signup week and calculates the percentage who returned during their second seven-day period.
| Signup cohort | New users | Retained users | Week 1 retention |
|---|---|---|---|
| Aug 3 | 400 | 172 | 43.0% |
| Aug 10 | 460 | 184 | 40.0% |
| Aug 17 | 510 | 224 | 43.9% |
| Aug 24 | 480 | 230 | 47.9% |
These illustrative results suggest that the August 24 cohort performed better than the earlier cohorts. Before attributing the difference to a product improvement, the team would need to examine changes in acquisition channels, user composition, seasonality, and other factors that could influence retention.
The measurement window must also be complete. Users need at least fourteen days of observable activity after signup for this metric to be calculated fairly. Cohorts that have not reached that point should be excluded from the comparison until enough data is available.
6. Example 5: Building a Cohort Analysis
Product question: How does retention evolve over several months?
Weekly retention provides a view of early engagement, but many products need to understand how behavior changes over longer periods. Cohort analysis makes it possible to compare groups of users who joined at different times and observe their activity as they mature.
For this example, we’ll group users by signup month and calculate whether they were active in subsequent calendar months.
WITH user_cohorts AS (
    SELECT
        user_id,
        DATE_TRUNC('month', signup_date)::date
            AS cohort_month
    FROM users
),
monthly_activity AS (
    SELECT DISTINCT
        user_id,
        DATE_TRUNC('month', event_timestamp)::date
            AS activity_month
    FROM events
    WHERE event_name = 'session_started'
),
cohort_activity AS (
    SELECT
        u.cohort_month,
        (
            EXTRACT(YEAR FROM AGE(
                a.activity_month,
                u.cohort_month
            )) * 12
            + EXTRACT(MONTH FROM AGE(
                a.activity_month,
                u.cohort_month
            ))
        )::int AS months_since_signup,
        COUNT(DISTINCT u.user_id) AS active_users
    FROM user_cohorts u
    JOIN monthly_activity a
      ON u.user_id = a.user_id
     AND a.activity_month >= u.cohort_month
    GROUP BY
        u.cohort_month,
        months_since_signup
),
cohort_sizes AS (
    SELECT
        cohort_month,
        COUNT(*) AS cohort_size
    FROM user_cohorts
    GROUP BY cohort_month
)
SELECT
    a.cohort_month,
    a.months_since_signup,
    s.cohort_size,
    a.active_users,
    ROUND(
        100.0 * a.active_users
        / NULLIF(s.cohort_size, 0),
        2
    ) AS retention_rate
FROM cohort_activity a
JOIN cohort_sizes s
  ON a.cohort_month = s.cohort_month
ORDER BY
    a.cohort_month,
    a.months_since_signup;
The query produces one row per signup cohort and elapsed month. These results can then be transformed into a retention matrix, where each row represents a cohort and each column represents the number of months since signup.
An illustrative matrix might look like this:
| Signup cohort | Month 0 | Month 1 | Month 2 | Month 3 |
|---|---|---|---|---|
| May 2026 | 88% | 51% | 39% | 33% |
| June 2026 | 90% | 54% | 42% | 36% |
| July 2026 | 89% | 57% | 44% | — |
| August 2026 | 91% | 59% | — | — |
Month 0 represents activity during the signup month. It is not necessarily 100%, since the metric counts users who generated a session event, rather than automatically treating every signup as active.
The empty cells indicate periods for which the cohort has not yet accumulated enough history. A cohort matrix can reveal patterns that are difficult to identify from overall monthly active user counts. For example, total activity might increase because the company is acquiring more users, even while the proportion of users returning after two months is declining.
Cohort analysis helps separate acquisition growth from changes in the behavior of existing users. It is particularly useful when evaluating onboarding improvements, changes to the product experience, or shifts in acquisition strategy.
7. Example 6: Comparing Product Metrics by Acquisition Channel
Product question: Which acquisition channels bring users who actually engage?
Acquisition reports often emphasize the number of signups generated by each channel. That information is useful for understanding volume, but it provides limited insight into the quality of acquired users.
A channel that generates large numbers of signups may produce relatively few activated users, while a smaller channel may attract people who are more likely to complete onboarding and continue using the product.
To investigate this, we’ll calculate activation rates by acquisition channel using the same seven-day activation definition introduced earlier.
WITH signups AS (
    SELECT
        user_id,
        signup_date,
        acquisition_channel
    FROM users
    WHERE signup_date >= DATE '2026-09-01'
      AND signup_date < DATE '2026-10-01'
),
activated AS (
    SELECT DISTINCT
        u.user_id
    FROM signups u
    JOIN events e
      ON u.user_id = e.user_id
    WHERE e.event_name = 'project_created'
      AND e.event_timestamp >= u.signup_date
      AND e.event_timestamp < u.signup_date
          + INTERVAL '7 days'
)
SELECT
    u.acquisition_channel,
    COUNT(DISTINCT u.user_id) AS signups,
    COUNT(DISTINCT a.user_id) AS activated_users,
    ROUND(
        100.0 * COUNT(DISTINCT a.user_id)
        / NULLIF(COUNT(DISTINCT u.user_id), 0),
        2
    ) AS activation_rate
FROM signups u
LEFT JOIN activated a
  ON u.user_id = a.user_id
GROUP BY u.acquisition_channel
ORDER BY activation_rate DESC;
An illustrative result could be:
| Channel | Signups | Activated users | Activation rate |
|---|---|---|---|
| Organic search | 350 | 189 | 54.0% |
| Referral | 180 | 90 | 50.0% |
| Paid search | 500 | 175 | 35.0% |
| Social media | 420 | 105 | 25.0% |
Organic search has the highest activation rate in this example, while paid search generates more signups but a lower proportion of activated users. The results could inform acquisition discussions, although activation alone is not enough to determine channel profitability. Marketing costs, retention, subscription conversion, and customer lifetime value may lead to different conclusions.
Differences in user intent also matter. Someone searching for a specific project management solution may arrive with a clearer need than someone who discovers the product through a general social media campaign.
Segmenting product metrics by acquisition source helps reveal these differences and supports more informed conversations between Product, Marketing, and Growth teams.
8. Example 7: Measuring Conversion From Free to Paid
Product question: What percentage of users become paying customers?
For a subscription-based product, converting free users into paying customers is often a central business metric. The calculation requires a clear definition of the conversion event and the population being measured.
In this example, we’ll measure the percentage of users who start a paid subscription within thirty days of signing up.
The subscriptions table contains subscription records, and we’ll assume that plan_name identifies the type of plan. A user is considered converted when they start a subscription whose plan is not free.
WITH new_users AS (
    SELECT
        user_id,
        signup_date
    FROM users
    WHERE signup_date >= DATE '2026-08-01'
      AND signup_date < DATE '2026-09-01'
),
paid_users AS (
    SELECT DISTINCT
        u.user_id
    FROM new_users u
    JOIN subscriptions s
      ON u.user_id = s.user_id
    WHERE s.plan_name <> 'free'
      AND s.started_at >= u.signup_date
      AND s.started_at < u.signup_date
          + INTERVAL '30 days'
)
SELECT
    COUNT(DISTINCT u.user_id) AS signups,
    COUNT(DISTINCT p.user_id) AS paid_users,
    ROUND(
        100.0 * COUNT(DISTINCT p.user_id)
        / NULLIF(COUNT(DISTINCT u.user_id), 0),
        2
    ) AS free_to_paid_conversion
FROM new_users u
LEFT JOIN paid_users p
  ON u.user_id = p.user_id;
If 1,200 users signed up during August and 144 started a paid subscription within thirty days, the conversion rate would be 12%. The result should be interpreted according to the product’s pricing and trial model. In a product with a fourteen-day free trial, conversion behavior may be concentrated around the end of the trial period. In a freemium product without a time-limited trial, users may take several months before deciding to upgrade.
The query also assumes that every non-free subscription represents a paid conversion. A production implementation may need to exclude complimentary plans, internal accounts, failed payments, or subscriptions that never became billable.
A useful next step would be to compare conversion rates across acquisition channels, subscription plans, or activation status. This can help identify whether certain onboarding behaviors are associated with a greater likelihood of becoming a paying customer.
9. Common SQL Mistakes in Product Analytics
Writing a query that executes successfully doesn’t guarantee that the resulting metric is correct. Product analytics depends on the relationship between the SQL logic, the underlying data, and the business definition being measured.
One common source of errors is counting events instead of users. If a user creates ten tasks, a query counting task_created events will return ten records. That may be appropriate when measuring task creation volume, but it would overstate adoption if the objective were to count how many users created at least one task. Using COUNT(DISTINCT user_id) can address this difference when the metric requires unique users.
Joins can introduce similar problems. When a users table is joined to an events table, a single user may appear in multiple rows because they generated several events. Aggregations performed after the join need to account for that relationship.
Time periods also require careful treatment. Comparing a fully observed monthly cohort with one that has existed for only a few days can produce misleading retention or conversion results. The analysis should either exclude incomplete cohorts or clearly indicate that their observation periods are shorter.
Another consideration is event tracking quality. SQL can retrieve only the information that has been recorded. If an event is missing, duplicated, incorrectly named, or triggered at the wrong point in a user journey, the resulting analysis may be unreliable even when the query is technically correct.
Finally, metric definitions should remain consistent across teams and reports. If Product defines an active user as someone who starts a session while Marketing uses any recorded event, their dashboards may report different active user counts for the same period. The SQL implementation should reflect an agreed definition, ideally documented alongside the metric.
10. From SQL Queries to Product Decisions
SQL becomes useful in product management when it supports a specific investigation. The starting point is usually a question about user behavior or business performance, followed by an examination of which data can answer it.
An activation query may reveal that fewer users are creating their first project. A funnel analysis can show where that decline occurs, while segmentation by acquisition channel may indicate whether the change is concentrated in a particular group. Those findings can then guide further analysis, usability research, or technical investigation.
The examples in this article cover several common analytical needs:
- Activation and early user behavior.
- Conversion funnels and onboarding.
- Feature adoption.
- Weekly retention.
- Monthly cohort analysis.
- Acquisition channel performance.
- Free-to-paid conversion.
Each query provides a particular view of the product. The interpretation depends on how the metric is defined, whether the data is reliable, and what other evidence is available.
Product Managers who want to develop these skills further can explore SQL for Product Managers, part of The Product Shelf collection. The book covers the SQL concepts used in product analytics, including filtering, aggregations, joins, date operations, funnels, cohorts, and translating business questions into queries.
For additional reference, the PostgreSQL documentation provides an introduction to SQL syntax and database queries.
Before using any query in a recurring report, validate its population, observation window and handling of duplicate or missing records. Save those definitions with the query so that later comparisons use the same calculation.