


A product dashboard may show rising registrations while the teams who signed up last month stop using the product. Both numbers can be correct. The difficulty is deciding which outcome needs attention, what behaviour might explain it and whether the data supports the proposed response. A product metrics framework connects those questions so that a review can lead to an investigation or a decision.
The framework records what the product is trying to achieve, how the team will measure progress and which other signals could reveal an unwanted effect. Its usefulness depends on the definitions and the decisions behind it. A North Star Metric, a lifecycle funnel and a revenue dashboard can all contribute, provided the team knows what each measure can establish and what remains uncertain.
Start with an outcome and a unit of analysis
Consider a hypothetical project management application sold to teams. The company wants more customers to keep using it after their initial setup. Revenue is relevant to that business, but a renewal happens too late to explain every difficulty in the first few weeks. The immediate product question is whether new teams begin collaborating and continue doing so.
Here the unit is a team, not an individual user. A team can contain several people, and the person creating the account may never be its most active member. Mixing individual signups in a denominator with active organisations in a numerator would produce a misleading rate. The framework therefore needs an agreed team identifier and rules for test accounts, duplicate organisations and customers who belong to several teams.
A metric measures a defined quantity; a KPI is a metric selected to judge progress towards an objective. The objective describes the result the team wants, such as improving continued use among newly acquired teams. Keeping that distinction makes it easier to explain why a particular measure belongs in the regular review and another is retained only for diagnosis.
Choose a structure that fits the question
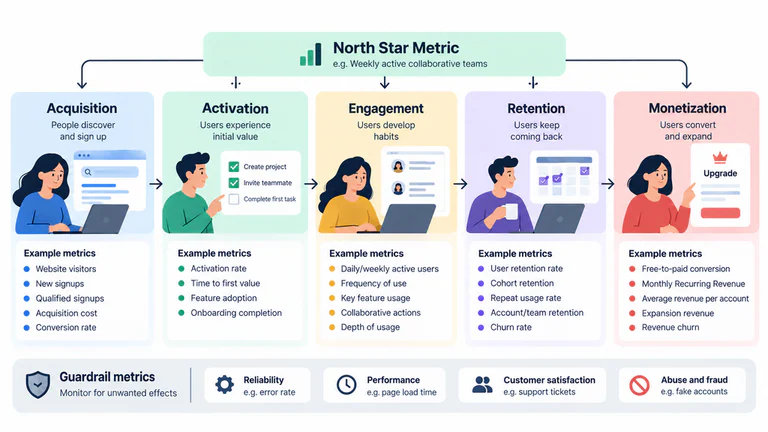
The North Star Framework described by Amplitude centres on a measure of customer value and the inputs that contribute to it. For the project application, a candidate could be weekly teams completing collaborative work. The team would still need to test whether the chosen activity represents value for its customers and relates to continued use.
A lifecycle view instead helps locate where teams stop progressing: acquisition, activation, repeated use, retention or payment. HEART, presented in Google’s research on user-centred metrics, examines happiness, engagement, adoption, retention and task success, with a process for connecting goals to signals and metrics. These structures address different measurement needs; a team can borrow relevant elements without filling every category.
For this example, the team chooses an outcome metric for new-team retention, a small set of onboarding inputs and reliability guardrails. The weekly collaborative-team count provides broader product context. Paid retention remains a business KPI, measured separately because keeping a subscription and continuing to use the application describe different outcomes.
Define meaningful activity before counting it
Opening the application may tell us that a person returned, but it does not establish that a team completed useful work. For this hypothetical product, collaborative activity means that at least two distinct members create, update or complete tasks in the same shared project during the observation window. This is a proposed definition for the example, not a universal definition of engagement.
The activation milestone uses that activity within the first seven days after team creation. The calculation is teams reaching the milestone within seven days / eligible new teams with a completed seven-day observation window × 100. If 420 of 1,000 eligible teams reach it, activation is 42%. These numbers are hypothetical. Teams created yesterday cannot yet be classified as failing a seven-day milestone.
A funnel can locate the steps before that milestone: creating a project, inviting another person and completing shared work. Specify the unit, sequence and allowed time between events, then deduplicate retries or repeated events. An invitation sent is different from an invitation accepted; either can be measured, but they answer different questions about the friction in onboarding.
Write definitions that another team can reproduce
The metric name is only a shorthand for a calculation. A reproducible definition identifies the population, qualifying event, denominator, time window, exclusions and data source. It also names the person responsible for resolving ambiguities. For the project application, the working framework could look like this:
| Measure | Definition | Decision it informs |
|---|---|---|
| Weekly collaborative teams | Distinct teams meeting the shared-work definition during a complete Monday-to-Sunday week, using the agreed reporting timezone. | Whether the overall population receiving collaborative value is growing. |
| Seven-day activation | Eligible teams reaching shared work within seven days of creation, divided by eligible teams whose full seven-day window has closed. | Which parts of early collaboration need investigation. |
| Fourth-week retention | Eligible teams with shared work on days 21-27 after creation, divided by eligible teams whose complete fourth-week window has closed. | Whether a new-team cohort continues using the product. |
| Project creation failure rate | Distinct failed project-creation operations divided by all eligible project-creation operations, using an operation identifier to group retries. | Whether a change is making the core workflow less reliable. |
In this retention definition, the creation date anchors each team’s observation window; it does not use calendar weeks. With 200 eligible teams and 70 returning in that fourth-week window, retention would be 35%. That cohort must have finished the window before it is compared with another complete cohort. The definition should also state how deleted teams are handled: silently removing unsuccessful customers from the denominator would inflate the result.

Separate a useful signal from a causal explanation
Suppose teams that reach collaborative activation also show higher fourth-week retention. That association makes activation worth investigating, but it does not demonstrate that making more people perform the measured event will cause them to stay. Teams with a strong existing need may be more likely both to collaborate early and to return later.
Product and Engineering could test an onboarding change intended to make the first shared task easier. Before launch, they would agree eligibility, assignment, success criteria and the observation period, including the later retention outcome. An improvement in seven-day activation is early evidence about onboarding; the team still needs the mature retention result and an analysis appropriate to the experiment before claiming a lasting effect.
Input metrics describe behaviours or conditions the team believes contribute to an outcome. A leading indicator offers an earlier signal of a later result when that relationship has evidence behind it. An outcome metric records the result itself. Those roles depend on the question: activation is an outcome for an onboarding experiment and may also be an input when investigating retention. Labelling a measure “leading” does not validate its predictive value.
Guardrails track effects the team does not want to worsen while pursuing its main goal. For this change, useful candidates could include project-creation failures and support requests about invitations. Decide how those measures will be interpreted and who can pause the rollout. A temporary increase in support requests may reflect confusion, a defect or simply more teams using the workflow; the count alone does not identify the cause.
Investigate a change before setting the next target
A decline in aggregate retention is a starting point. Compare cohorts with the same observation window and inspect acquisition channel, plan, team size or other relevant differences. A campaign that brings a different customer mix can move the overall rate even when comparable groups behave similarly. Report the number of teams behind each percentage, especially when a segment is small.
Check instrumentation before interpreting an abrupt shift. A duplicated event, a missing team identifier or a delayed data pipeline can change the calculation without changing what customers do. Compare a sample of recorded events with the operational records and document known coverage gaps. SQL helps examine those records and reproduce cohort calculations; the guide to SQL for product analytics develops that connection.
Only then does a baseline become useful for setting a target. Historical variation, the population affected and the expected mechanism of the proposed change should inform the ambition. A target chosen because it looks attractive on a slide provides little guidance when the team has to decide which customer problem to address.
Keep the framework usable as the product evolves
Review operational guardrails at a frequency that allows the team to respond to failures, and review retention when the relevant cohorts have matured. In each product review, record what changed, the strongest available explanation, the uncertainty and the next action. If a metric has not informed a decision for several reviews, reconsider its place in that meeting rather than adding another dashboard by default.
Definitions also need version control. If shared work starts including a newly introduced task type, annotate the change and establish whether the historical calculation can be reproduced. Do not place old and new definitions on the same trend line without explaining the difference. The same discipline applies when eligibility rules, timezones or event sources change.
Product Metrics for Product Managers develops metric definitions, funnels, cohorts, North Star metrics and guardrails through a fictional SaaS. For investigating whether a change reflects product behaviour or a technical failure, the logs and observability guide provides the operational context. Keep the metric definition, its current limitations and the decision it informs together so that the next reviewer can follow the calculation.