

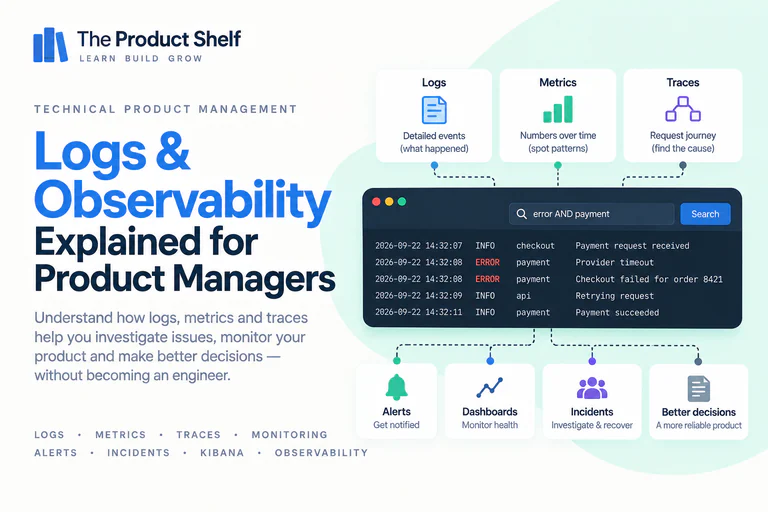
A product can look perfectly healthy from the outside while something is already going wrong underneath. A payment service may be producing errors, an API may suddenly be responding more slowly or a new release may be affecting only a small percentage of users.
Logs record events, metrics summarise measurements and traces follow operations through a system. Teams use these signals to investigate production behaviour and assess whether a change has affected a user journey.
For Product, the connection to customer experience matters during an incident: which journey is failing, how many people are affected and whether a workaround is available. Following the evidence Engineering is examining helps keep those decisions tied to what is known.
What are logs?
Software constantly performs actions: users log in, requests reach APIs, payments are processed, background jobs run and systems communicate with each other. Applications can record information about many of these events in logs.
A log entry might tell you that a request arrived at a particular time, which service handled it, whether it succeeded and, if something failed, what type of error occurred.
Two illustrative entries for a payment service could record a successful request for order 8421 at 10:42:31 and a provider timeout for order 8422 at 10:43:07. The timestamp, order identifier and result provide different ways to locate related activity.
One log entry rarely tells you everything about a product problem, but thousands or millions of them create a detailed record of what the software has been doing. For Product Managers, logs are useful to understand because they often provide the technical evidence behind statements such as “we’re seeing errors in checkout” or “the problem only seems to affect requests to this service.”
Why should Product Managers understand logs?
Imagine Customer Support reports that some users can’t complete checkout. The product analytics dashboard may show that conversion has fallen, but it probably won’t explain what happened inside the system.
Engineering might then look at the logs and discover that requests to a payment provider are timing out. The investigation has moved through several layers:
Checkout conversion ↓ → Users reporting failures → Payment errors in logs → External provider timeout
Logs can connect the reported checkout failure with a provider timeout. That finding still needs investigation: the team must establish which requests failed and whether customers could complete payment after retrying.
It also helps when reporting problems. “Checkout doesn’t work” gives Engineering much less to work with than knowing when the issue occurred, which user journey was affected and whether there are identifiers that can help locate the corresponding activity in the logs.
What information can a log contain?
The exact information recorded depends on the application, but logs often contain details such as a timestamp, the service or component involved, the action being performed, the result and information about any error that occurred.
They may also contain identifiers that allow engineers to connect an event with a particular request, transaction or process. For example: Timestamp: 10:43:07
Service: Payment Service
Order ID: 8422
Action: Process payment
Result: ERROR
Reason: Provider timeout Not every system records the same information, and there are important security and privacy considerations around what should and shouldn’t appear in logs. But the basic purpose is consistent: logs leave evidence that can help teams reconstruct what the software was doing at a particular moment.
Log levels
Not every event recorded by an application has the same importance. Teams often use log levels to distinguish routine information from potential problems.
You may encounter levels such as:
- DEBUG — detailed information mainly useful during investigation or development.
- INFO — normal events that describe what the application is doing.
- WARN — something unusual happened, although the system may still be working.
- ERROR — an operation failed or a significant problem occurred.
The exact conventions vary between teams, so an ERROR doesn’t automatically mean the entire product is broken. It may represent one failed operation among millions of successful ones. This is why context matters. Seeing 100 errors sounds worrying until you know whether they came from 120 requests or 20 million.
What is Kibana?
When applications generate enormous volumes of logs, reading individual files isn’t practical. Tools such as Kibana allow teams to search, filter and explore that information much more efficiently. An engineer investigating a checkout problem might filter logs by a specific time period, service, error type, order identifier or other available fields. Instead of looking through everything the system produced, they can narrow the search to the activity relevant to the incident.
For example, an investigation might start with:
Time: 14:00–14:15
Service: payment-service
Level: ERROR
and then narrow further when a pattern appears. A Kibana search narrows the available events by time, service or another field. The result represents the records matching those filters; missing records may reflect the search, retention rules or gaps in instrumentation.
Searching and filtering logs
Logs become useful when you can reduce a huge volume of information to the events relevant to the problem you’re investigating. Suppose a customer reports that an order failed at approximately 15:32. If you know the order ID, Engineering may be able to search for that identifier and follow what happened as the request moved through the system.
A useful report might therefore include:
User: affected customer
Time: approximately 15:32
Order ID: 8421
Action: attempted payment
Observed result: payment failed That information gives the team several possible ways to find the corresponding technical events.
A report containing the time, journey and relevant identifier gives Engineering a starting point for locating events. Sensitive account or payment details should remain in the team’s approved support systems.
Correlation and request IDs
A single user action may pass through several services before it is completed. Imagine a checkout request moving through:
Frontend → Checkout Service → Order Service → Payment Service → Payment Provider
If every component generates its own logs, investigating the complete journey can become difficult. Teams therefore often use identifiers that allow related events to be connected. A request ID or correlation ID can travel with the request as it moves through the system. Engineers can then search for that identifier and reconstruct what happened across multiple components.
Conceptually:
Request ABC123
→ Checkout Service
→ Order Service
→ Payment Service
→ External Provider
For Product Managers, the important idea is simply that one user action can generate activity across many systems, and teams need ways to connect those pieces during an investigation.
Logs vs metrics
Logs provide detailed records of individual events, while system metrics summarise behaviour over time. An individual entry might record that request 8421 failed at 10:43:07. A metric could summarise the same period as an 8.4% payment error rate over ten minutes. These hypothetical figures answer different questions: the entry identifies an event, while the rate describes its frequency within a defined population.
Both are useful, but they answer different questions. Metrics are often better at showing that something unusual is happening across the system, while logs can help investigate individual events and understand what actually happened.
A team might first notice an increase in an error-rate metric and then use logs to investigate the failures behind that increase. This relationship between high-level signals and detailed evidence is central to understanding observability.
What is monitoring?
Monitoring involves continuously tracking selected signals so teams can understand whether a system is behaving within expected limits.
A team might monitor:
- Error rate
- Response time
- CPU or memory usage
- Request volume
- Failed payments
- Application crashes
These signals can be displayed on dashboards and watched over time. The team already knows that these things matter, so it deliberately measures them. For example, a dashboard might show:
API error rate: 0.3%
Average response time: 220 ms
Payment success rate: 98.7% If one of those values changes significantly, it can provide an early indication that something needs attention.
Alerts
Teams can’t watch every dashboard continuously, so monitoring systems can generate alerts when certain conditions occur. An illustrative alert rule could trigger when the payment error rate stays above 5% for five minutes. Another might watch a defined response-time measure for the API. Thresholds need a measurement window, a clear definition and an action the recipient can take.
An alert doesn’t necessarily explain the problem. It tells the team that a predefined condition has been met and that someone may need to investigate. This distinction matters because an alert is the beginning of an investigation, not the diagnosis itself. “The payment error alert fired” tells you what signal changed; the next question is why.
Monitoring vs observability
Monitoring and observability are closely related, but they aren’t exactly the same thing. Monitoring focuses heavily on known signals. The team decides in advance that error rate, latency or CPU usage matter and tracks them.
Observability is the broader ability to understand what is happening inside a system by examining the information it produces. It becomes particularly valuable when something unexpected happens and the team doesn’t already have a dashboard designed specifically for that problem.
Monitoring checks selected conditions over time. An unexpected checkout failure may require examining signals beyond those existing checks, following a request across services or comparing affected and unaffected traffic. The available instrumentation determines how far that investigation can go.
In practice, the two overlap significantly, and teams may use the terms in slightly different ways.
Logs, metrics and traces
Three types of information commonly appear in observability conversations: logs, metrics and traces.
Logs provide detailed records of individual events. Metrics summarise behaviour numerically over time. Traces help show how a request moves through different parts of a distributed system.
Together, they provide different perspectives on the same product:
LOGS → What happened?
METRICS → How much or how often?
TRACES → Where did the request go?
Imagine checkout suddenly becomes slow. A metric might reveal that response time has doubled. A trace could show that most of the delay occurs when the Payment Service calls an external provider, while logs from that service may contain more detailed information about what happened during those requests.
None of these signals needs to tell the whole story on its own.
What are traces?
Modern applications can involve many services communicating with each other. A trace follows a request as it moves through those components.
Imagine a user submits an order:
Frontend → Checkout → Orders → Payments → Database
The total request takes three seconds, but that alone doesn’t tell us where the time was spent. A trace might reveal: Checkout: 100 ms
Orders: 150 ms
Payments: 2,600 ms
Database: 80 ms
Now the team has a much clearer place to investigate. Traces expose how time is distributed across an instrumented request. Their coverage depends on which services and external calls emit trace information, so an incomplete trace may leave part of the delay unexplained.
What is an incident?
An incident is an event that disrupts or degrades the normal operation of a product or system. It could affect everyone or only a subset of users, and the severity can range from a minor degradation to a complete outage of a critical capability.
Examples might include checkout becoming unavailable, login failures increasing dramatically, an API responding extremely slowly or a mobile release causing the application to crash for certain users. During an incident, the priority is usually to understand the impact, restore service and reduce harm as quickly as possible. Determining the deeper root cause may happen after the immediate problem has been stabilised.
For Product Managers, incidents often require coordination between technical investigation and product impact: What is broken? Who is affected? How severe is it? Is there a workaround? What do customers need to know?
A typical incident flow
Although every organisation handles incidents differently, the general process often follows a recognisable pattern:
Detection → Triage → Investigation → Mitigation → Recovery → Learning
The problem may first be detected through an automated alert, a product metric, Customer Support or even users reporting it directly. The team then tries to understand the scope and severity before investigating the technical cause. Once enough is known, they may mitigate the issue by disabling a feature, stopping a rollout, rolling back a deployment or using another recovery mechanism.
After the service has recovered, the focus can move from “How do we stop the impact?” to “Why did this happen, and what should we change as a result?” Product Managers can play an important role throughout this process by helping quantify user impact, prioritise critical journeys and coordinate decisions that affect customers.
Product metrics vs system metrics
Product teams and Engineering teams often look at different types of signals, and both can be necessary to understand what is happening.
A system metric might show:
API error rate ↑
while a product metric shows:
Checkout conversion ↓
The technical metric tells us something has changed in the system. The product metric tells us that the change may be affecting customer behaviour. Neither one automatically proves that the other caused it, but seeing both move at the same time gives the team a strong reason to investigate the relationship.
This is why observability shouldn’t be treated as completely separate from Product Analytics. Technical behaviour can have direct product consequences, and sometimes the first sign of a technical problem appears in a business or product metric.
Observing behaviour after a release
Observability is often associated with outages, but it can also help teams understand normal product behaviour. Suppose a new feature depends on an external API. After launch, the team may want to know how frequently that API is called, how long it takes to respond, how often requests fail and whether usage is growing as expected.
Those signals can reveal potential constraints before they become incidents. The same applies after a release. Engineering may monitor technical health while Product watches adoption, conversion or other behavioural metrics. Together, those signals provide a much better picture of whether the release is working as intended.
After a release, these signals can reveal rising provider latency or unexpected call volumes before the team receives customer complaints. Comparing them with product metrics helps assess the effect on the journey.
Questions Product Managers should ask about observability
For each critical capability, the team can agree which signals will be reviewed after launch, who will receive alerts and which user outcome those signals help assess. For a critical journey, it is useful to know what the team monitors and how quickly a problem would become visible. If checkout starts failing, would an alert fire within minutes, or would the team only discover it when customers begin contacting Support?
You can also ask what information would be available during an investigation. Are there logs for the relevant services? Can requests be traced across systems? Can failures be broken down by platform, version or provider?
Recovery matters too. Once a problem has been detected, who is alerted, who owns the affected system and what options exist to reduce the impact? These questions aren’t about managing Engineering’s observability setup. They’re about understanding how confidently the organisation can operate the product once it is in users’ hands.
Writing useful bug reports
One practical way Product Managers can help technical investigations is by providing good information when reporting a problem. A hypothetical report could state that account 4821 attempted payment at 14:32 CET, received an error after submitting card details and reproduced the problem twice on Android app version 4.6, with order ID 8421. This gives Engineering a time window and identifiers to investigate while keeping the cause open.
Useful information can include the time the issue occurred, user or account identifiers when appropriate, order or transaction IDs, application version, platform, environment, steps taken and the result the user saw.
A report should make it possible to locate the affected journey in time and connect it with the available system records. When an identifier is unavailable, record that limitation alongside the known facts.
Do Product Managers need to know Kibana?
Access to Kibana varies between organisations. Some PMs can inspect logs directly; others work with Engineering because production records contain sensitive information or require specialist interpretation. However, being comfortable with the basic idea of searching and filtering logs can be surprisingly useful. If an engineer shares a Kibana screen during an incident, you should be able to understand that you’re looking at events produced by the system, filtered according to things such as time, service or error type.
When the team shares a search, establish the time window, filters and identifiers first. Those choices determine which events are visible.
Do Product Managers need to understand observability?
During an incident, Product can establish the affected journeys and customer impact while Engineering investigates the technical cause. Both assessments may change as new evidence arrives. A useful foundation includes knowing the role of logs, log levels, metrics, monitoring, alerts, traces, correlation IDs and incident management, as well as understanding how these technical signals can connect with product metrics.
That division of work also informs recovery priorities: restoring a critical payment flow may take precedence over repairing a less disruptive background task, even if both generate errors.
Go deeper: Logs, Kibana & Observability for Product Managers
The book Logs, Kibana & Observability for Product Managers develops log searches, monitoring, traces and incident assessment through product scenarios.
Observability connects naturally with several other areas of Technical Product Management. Software architecture helps you understand the components producing these signals, APIs explain how many of those systems communicate, Product Metrics show how technical behaviour can affect users, and CI/CD explains how new changes reach production in the first place.
Continue with the Technical Product Management learning path to explore APIs, software architecture, SQL and data, product metrics, security and CI/CD.
Explore the book → Logs, Kibana & Observability for Product Managers
Continue learning Technical Product Management
Explore the Technical Product Management learning hub